
Last updated: 8 October 2026. Every screenshot below was recorded on 5 and 8 October 2026 on an IQ Option Practice account registered in Brazil, and nothing was traded with real money. The formulas and default settings come from the Quadcode Script Library, the public source code of the platform’s built-in indicators; the screenshots show what the platform’s own dialog contains. This guide has no tested box, because neither indicator gives an entry rule. Nothing here is a promise of profit.
The Volume Oscillator compares a short and a long exponential average of volume and shows the gap as a percentage of the long one, so a reading above zero means recent volume is higher than its longer-term average. Net Volume gives each candle’s volume a sign: positive if the price source rose from the previous candle, negative if it fell. Both are in the Volume list of the Chart analysis panel; both depend on the asset’s volume data, and neither gives a buy or sell signal on its own.
Quick answer
- Volume Oscillator: (short EMA of volume – long EMA of volume) ÷ long EMA × 100. Source-code defaults: Short Cycle 5, Long Cycle 10, counted in candles. Above zero, recent volume is above its longer average.
- Net Volume: each candle’s volume, positive if the price source rose from the previous candle, negative if it fell, zero if unchanged. It is not a running total.
- Where they are: indicators button, Chart analysis, Indicators tab, Volume list. Each opens in its own panel under the chart.
- Limit: both read the asset’s volume series, which on forex may count ticks or one data source’s activity. Neither gives an entry rule.
Trade volume
Trade volume is the number of contracts or securities traded over a period. IQ Option’s blog describes volume as a measure of how much an asset is being traded at a particular moment, and notes that, unlike most indicators, volume does not come from the price chart itself: it is separate data. Both indicators in this guide take that volume series and turn it into a line under the chart. When price and volume stop agreeing, for example a new high on falling volume, that is a reason to look at the chart more closely; it is not a forecast.
What the volume series counts depends on the asset. For forex, IQ Option’s blog warns that the volume on a retail chart “may represent ticks or activity from a particular data source, not all global FX trading”. The platform’s own Volume widget describes its bars as showing how much of the asset “was bought and sold within a given period”, and neither of the two indicator dialogs says what its volume series counts, so this guide does not say either. Our guide to reading trading volume covers the volume widget and how to read raw volume bars.
Volume indicators
IQ Option’s blog says the platform has four volume indicators: Accumulation/Distribution, Net Volume, Volume Oscillator and Weis Wave Volume. They are in the Volume list of Chart analysis. This guide covers Net Volume and the Volume Oscillator; the others have their own guides, Accumulation/Distribution and Weis Wave Volume.
The Volume Oscillator
The Volume Oscillator (VO) takes two exponential moving averages of volume, a short one and a long one, and plots the difference as a percentage of the long one: VO = (short EMA – long EMA) ÷ long EMA × 100. In the Quadcode source the defaults are a Short Cycle of 5 and a Long Cycle of 10, and both can be set from 1 to 200. The source uses exponential averages and counts candles of whatever size the chart shows.
Because the gap is divided by the long average, the reading is a percentage: it does not depend on how large the asset’s volume numbers are, and it cannot fall below -100. At zero the two averages are equal. Above zero the short average, which reacts faster, is above the long one, so recent volume is higher than its longer-term average; below zero it is lower. A rising line means the short average is rising relative to the long one. IQ Option’s blog describes the line as showing “not the volume itself but rather the change in volume”, and says a rising oscillator signals increasing interest.
Example with made-up numbers: if the 5-candle average of volume is 120 and the 10-candle average is 100, the oscillator reads (120 – 100) ÷ 100 × 100 = +20. If the short average is 80, it reads -20.
| Setting | Source-code default | What it does |
|---|---|---|
| Short Cycle | 5 | Length, in candles, of the fast exponential average of volume (1 to 200) |
| Long Cycle | 10 | Length, in candles, of the slow exponential average of volume (1 to 200) |
| Line colour and width | green, width 1 | Style of the VO line |
| Baseline | shown | The zero line; its colour, width and visibility can be changed |
What is the Net Volume indicator?
Net Volume (NV) puts a sign on each candle’s volume. IQ Option’s blog describes it as uptick volume minus downtick volume over a period, and reads a value above zero as bullish sentiment and a value below zero as bearish. On a candle chart the indicator does this one candle at a time.
Net Volume indicator calculation
For each candle the source code compares the price source with its value on the previous candle. If it is higher, Net Volume is that candle’s volume; if it is lower, Net Volume is minus that candle’s volume; if it is unchanged, the value is zero. The line is not added up from candle to candle: each point stands alone, so its distance from zero is the candle’s volume and its sign is the direction of the price change. Example with made-up numbers: a candle with a volume of 300 that closes above the previous close plots at +300, and the next candle, with a volume of 150, closes lower and plots at -150.
The one setting that changes the numbers is Source, the price series whose change decides the sign. Its default is close. A positive value means only that the price source rose on that candle; it does not show who was buying.
| Setting | Source-code default | What it does |
|---|---|---|
| Source | close | The price series whose change from the previous candle sets the sign |
| Line colour and width | blue, width 1 | Style of the Net Volume line |
| Baseline | shown | The zero line; its colour, width and visibility can be changed |
How to add the Volume Oscillator and Net Volume to the IQ Option chart
These steps use the web traderoom on a Practice balance. The numbers in each screenshot match the numbers in the text.
Step 1: Open Chart analysis
Click the indicators button (1), the wave icon in the chart toolbar at the bottom left of the chart. The Chart analysis panel opens with the tabs Indicators, Templates, Widgets and Scripts.

Step 2: Find the Volume Oscillator
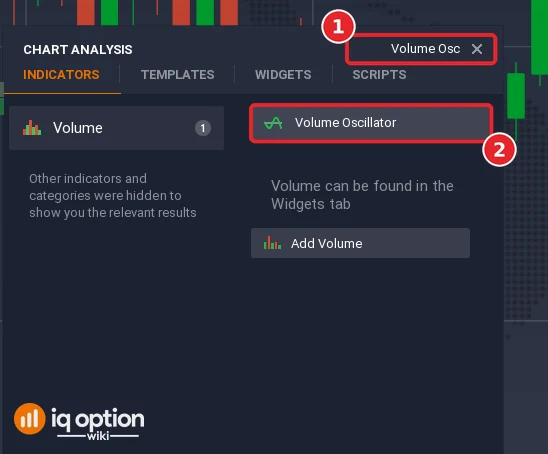
On the Indicators tab, type “Volume Osc” in the Search for indicators box (1) and click Volume Oscillator (2); the list narrows to the Volume group. You can also open the Volume list without typing. The Volume list also carries a note that Volume can be found in the Widgets tab and an Add Volume button; that is the volume widget, covered in our guide to reading trading volume.
Step 3: Check the cycles and apply
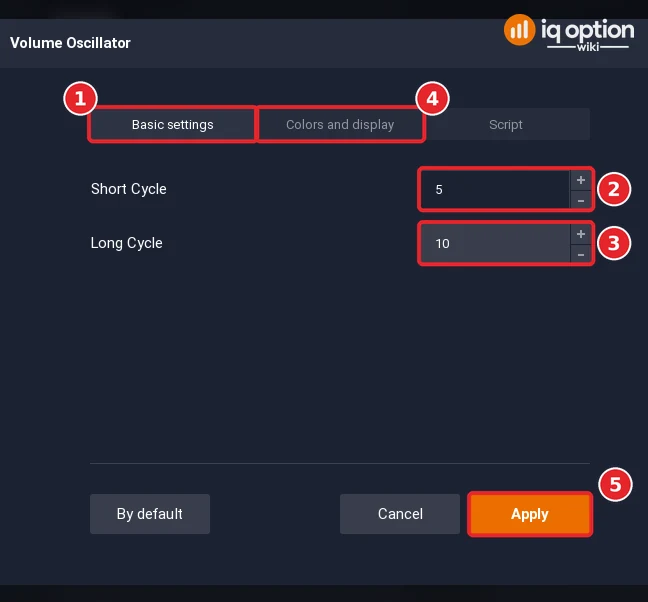
The dialog has three tabs: Basic settings (1), Colors and display (4) and Script. On Basic settings, Short Cycle (2) and Long Cycle (3) open at 5 and 10. Colors and display holds the line colour, the line width and the zero line. Click Apply (5) to add the indicator. The By default button is named for restoring the opening values.
Step 4: Add Net Volume
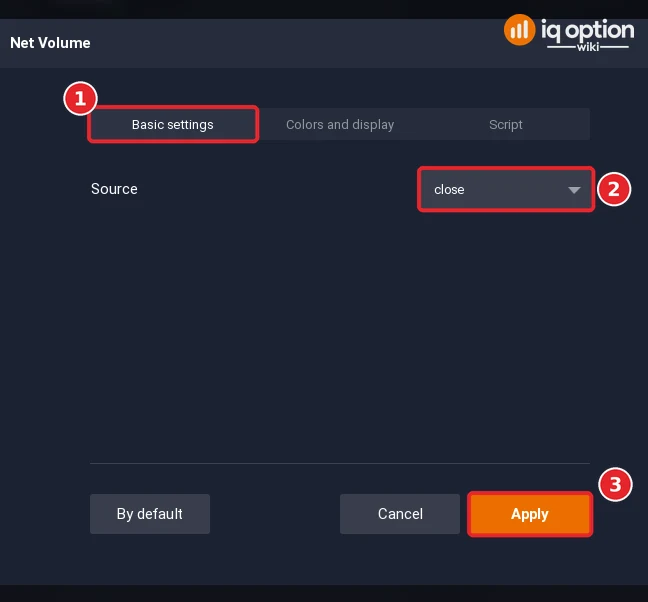
Type “Net Volume” in the search box and click Net Volume, or open the Volume list again and click it there. The dialog opens on Basic settings (1), where the only field is Source (2), which decides the price series that sets the sign; it opens on close. Click Apply (3).
Step 5: Read the two panels
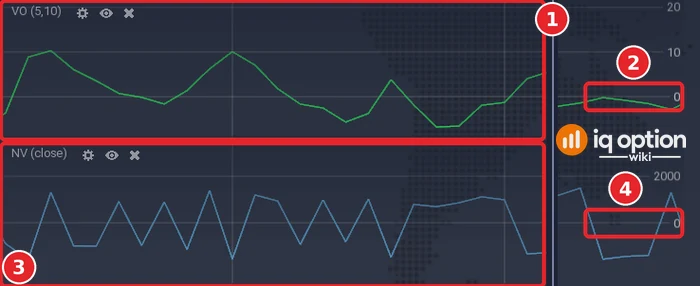
Each indicator opens in its own panel under the price chart; the panel headers read VO (5,10) and NV (close), each with a settings icon, a hide icon and a close icon. In the Volume Oscillator panel (1) the green line moves around its zero line (2); in the Net Volume panel (3) the blue line jumps above and below its own zero line (4) from candle to candle.
How to validate price action with the two indicators
Neither indicator has an entry rule. Used on a chart, they answer three questions about a price move. IQ Option’s blog puts the general idea this way: a price move backed by strong trading volume is more trustworthy than one that is just drifting along. The readings below are questions to ask, not signals.
- Did the move come with more volume than usual? On a breakout or a strong candle, look at the Volume Oscillator: above zero and rising means recent volume is running above its longer average; falling toward or below zero means the move came with less.
- Is volume fading while price keeps going? A new high while the Volume Oscillator is falling means volume is shrinking against its longer average as price pushes higher. It is a reason to look closer, not a forecast.
- Which side carried the volume? In the Net Volume panel, tall positive points mean large-volume candles that rose, tall negative points large-volume candles that fell. Compare the last several candles, not one.
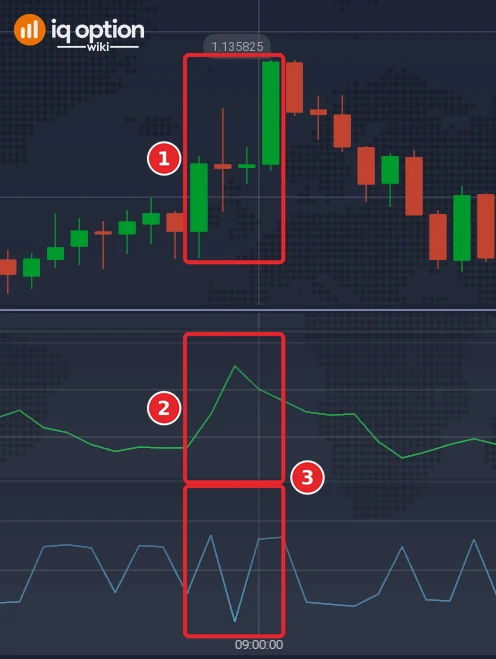
On EUR/USD 5-minute candles, the price rose 10.2 pips in four candles, from the close of 1.134795 at 08:40 to 1.135815 at 09:00 on 29 September 2026 on the platform clock (1). Over the same candles the Volume Oscillator went from -2.3 at 08:40 to +15.1 at 08:50 and back to +7.7 at 09:00 (2): recent volume ran well above its 10-candle exponential average. The Net Volume points were +1,435 at 08:45, -2,095 at 08:50, +1,270 at 08:55 and +1,348 at 09:00 (3). The biggest-volume candle of the four, 08:50, closed 0.25 pips lower than the one before, so the largest point is negative even though the price rose over the four candles. The two panels therefore say: volume was high, and it was not all on one side. That is a reason to look closer, not a signal. The values come from a replay of the recorded candles and volumes with the formulas above; they match the lines drawn in the panels (the Volume Oscillator peaks at about 15 and the Net Volume bottoms at about -2,000 on 08:50).
To see whether a volume check helps your own entries, note the Volume Oscillator reading beside each Practice trade and compare the results over a few dozen trades.
Pros and Cons of Volume-Based Indicators
| Pros | Cons |
|---|---|
| The oscillator is a percentage, so readings are comparable between assets with very different volume numbers. | Both depend on the asset’s volume data, which on forex may count ticks or one data source’s activity (IQ Option’s blog). |
| Net Volume shows at a glance whether the large-volume candles were up candles or down candles. | Net Volume gives a candle’s whole volume to one side, even when the price source moved only a little. |
| Both are built into the Volume list; nothing has to be imported. | With the short defaults of 5 and 10 candles, one large-volume candle can move the oscillator a lot. |
Conclusion on Net Volume indicator and Volume Oscillator
The Volume Oscillator tells you whether recent volume is above or below its longer average, as a percentage. Net Volume tells you, candle by candle, how much volume came with a rise and how much with a fall. Both read the asset’s volume series, so check what that series counts before you lean on it, and use them with price analysis rather than instead of it.
Common mistakes
- Reading Net Volume as buying and selling. A positive value means the price source rose on that candle, nothing more.
- Expecting the oscillator to stay between -100 and +100. It cannot fall below -100, but it has no upper limit.
- Comparing panels of different assets without checking their volume data. The oscillator is a percentage, so its scale carries over, but both lines depend on that asset’s own volume series.
Related guides
- How to read trading volume on IQ Option
- Weis Wave Volume on IQ Option
- Accumulation/Distribution on IQ Option
- Moving averages on IQ Option
- Support and resistance lines on IQ Option
- All indicator guides and all strategy guides
Frequently Asked Questions
Q: What does the Volume Oscillator show?
A: The gap between a short and a long exponential average of volume, as a percentage of the long one. Above zero, recent volume is higher than its longer average; below zero it is lower.
Q: What are the default settings of the Volume Oscillator?
A: In the Quadcode source, a Short Cycle of 5 and a Long Cycle of 10, both counted in candles. The dialog opens with those values.
Q: How is Net Volume calculated?
A: Each candle’s volume is counted as positive if the price source rose from the previous candle, negative if it fell and zero if it did not change. The values are not added up from candle to candle.
Q: Do both indicators work on every asset?
A: They need volume data. Both drew a line on EUR/USD (Binary) in our recording. We did not check other assets, so look at the panel on the asset you trade.
Q: Can I trade on these two indicators alone?
A: They do not give an entry rule. IQ Option’s blog says volume works as a complementary tool alongside other indicators.

