
Last updated: 8 October 2026. Every screenshot below was recorded on 8 October 2026 on an IQ Option Practice account registered in Brazil, on EUR/USD 5-minute candles; the Chart analysis picture in Step 1 was recorded on 5 October 2026. We placed no real-money trade. The settings come from the platform’s dialog and the calculation from the published source code of the platform’s built-in indicators (Quadcode’s script library). The tested box shows what three conditions for a long and for a short did on EUR/USD candles recorded between 29 September and 5 October 2026; it says nothing about what will happen next.
The Elder Ray Index measures how far each candle reached above and below an exponential moving average of the close. Bull Power is the high minus the EMA and Bear Power is the low minus the EMA, with a period of 13 by default. On IQ Option they are drawn as two sets of bars, green for Bull Power and red for Bear Power, in a panel under the price chart around a zero line. They are combined with the slope of the EMA: a long when the EMA rises, the Bull Power peaks are getting higher and the Bear Power is negative and rising; a short on the mirror conditions. On 5-minute EUR/USD candles that rule gave 114 signals, and its results were close to the break-even rate.
Quick answer
- What it plots: two sets of bars around a zero line in a panel under the price chart: Bull Power (green) and Bear Power (red).
- Formula: Bull Power = high − EMA(close, 13); Bear Power = low − EMA(close, 13).
- Settings on the platform: Period 13.
- Reading: Bull Power above zero means the candle’s high is above the EMA; Bear Power below zero means its low is below. Their changes are read together with the EMA’s slope.
- Where: the Other list of the Chart analysis panel; search for Elder Ray.
- Tested: the three-condition rule gave 114 signals on 5-minute candles; 1-candle trades won 49.6% of the decided trades, 3-candle trades 54.9%; on 1-minute candles 132 signals and 52.3%. Break-even is 54.1% at an 85% payout, and a few days of one pair prove nothing.
How do you add the Elder Ray Index on IQ Option?
Set the chart
Choose the asset, the chart type and the candle size first: the indicator is calculated from the candles on the chart. The examples in this guide use 5-minute candles on EUR/USD. These steps use the web traderoom on a Practice balance, and the numbers in each screenshot match the numbers in the text. If you do not have an account yet, see how to register.
Step 1: Open Chart analysis
Click the indicators button (1), the wave icon in the chart toolbar at the bottom left of the chart. The Chart analysis panel opens with the tabs Indicators, Templates, Widgets and Scripts. Stay on Indicators.

Step 2: Find Elder Ray Index
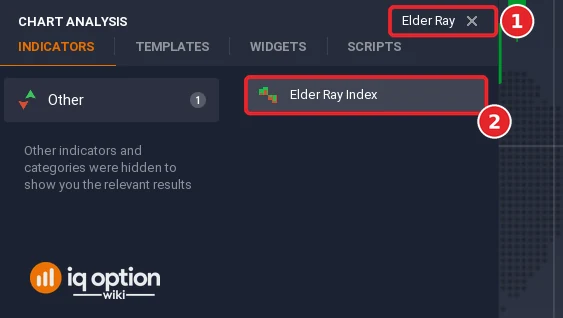
Type “Elder Ray” in the Search for indicators box (1), or open the Other list, and click Elder Ray Index (2).
Step 3: Check the settings
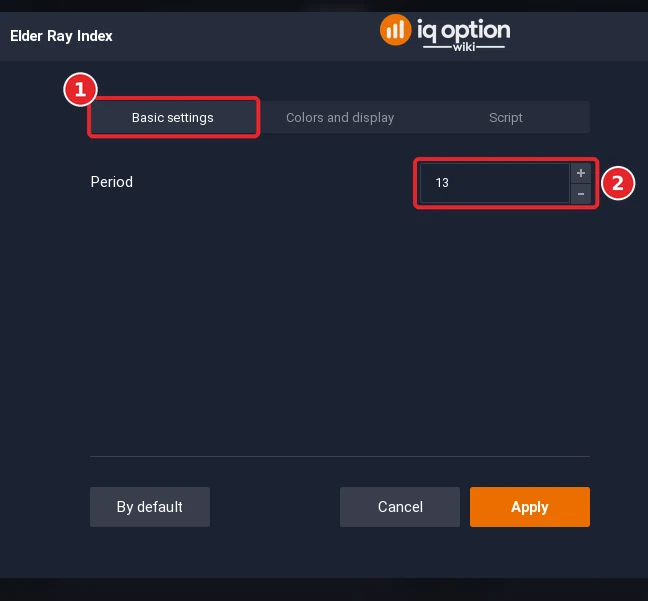
The dialog has the tabs Basic settings (1), Colors and display and Script. The Period (2) opens at 13, the length of the EMA of the close that both powers are measured from.
Step 4: Check the colours and click Apply
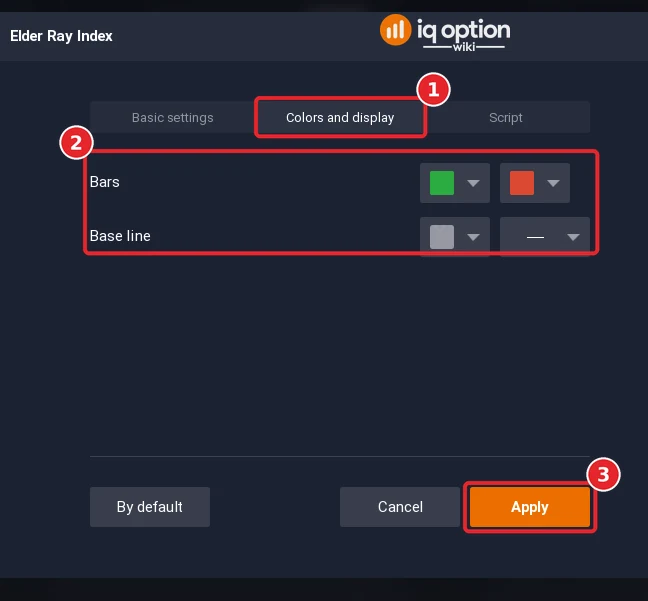
Open the Colors and display tab (1). The tab has two rows: Bars, with two colour boxes, green for Bull Power and red for Bear Power by default, and Base line, the grey zero line, with its colour box and a line-style box. Click Apply (3).
Step 5: Read the panel
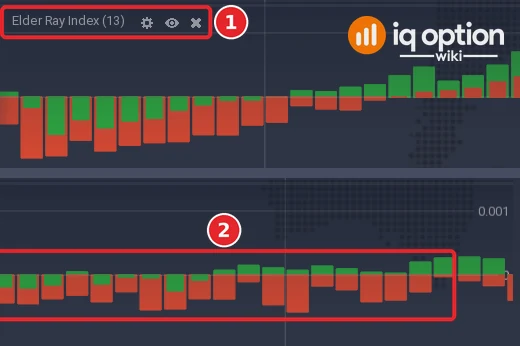
The panel under the price chart is titled Elder Ray Index (13) (1). The bars (2) rise and fall around the zero line: the green and red bars are Bull Power and Bear Power, drawn one over the other, and the scale at the right edge is in price units, for example 0.001 and 0.
How is the Elder Ray Index calculated?
The Quadcode source computes an exponential moving average of the close over the Period (13). Bull Power is the high of the candle minus that average, and Bear Power is the low of the candle minus the same average. Both are drawn as bars from the zero line: the Bull Power in green, wide when it is positive, and the Bear Power in red. Because the high is never below the low, Bull Power is always above Bear Power on the same candle.
| Part | Default | What it does |
|---|---|---|
| Period | 13 | Length of the EMA that both powers are measured from |
Dr Alexander Elder developed the tool in 1989 and named it after an X-ray machine, because it scans the market for buying and selling pressure; it is usually based on a 13-day EMA, and Elder himself used a 26-day EMA with weekly charts. The Bull Power is the strength of buyers and the Bear Power the strength of sellers.
How do you read the Elder Ray Index?
The two powers are paired with the slope of the EMA, since the EMA shows the trend and the powers show who is pushing inside it. Long: the EMA is rising, the latest peak of the Bull Power is higher than the previous one (the bulls are getting stronger), and the Bear Power is below zero and rising (the bears are getting weaker). Short: the EMA is falling, the Bull Power is above zero and diminishing (the bulls are getting weaker) and the Bear Power is falling. Entries can also come from divergences between a power and the price, and, because it uses a moving average, the index lags and needs other tools.
What did it look like on 5-minute candles?
We replayed the library script on EUR/USD 5-minute candles recorded from the Practice traderoom: 1,093 candles from 29 September 2026 (01:55 UTC) to 2 October (20:55 UTC) and 241 from 4 October (21:00 UTC) to 5 October (17:00 UTC). With the default period the bars start on the 13th candle of each stretch, 1,308 candles in all.
- Bull Power: from −20.4 to +27.8 pips; above zero on 802 candles (61%).
- Bear Power: from −37.6 to +16.5 pips; above zero on 346 candles (26%). The Bear Power is positive only when the whole candle is above the EMA.
Two stills of the platform, window A (the Step 5 picture) and window B (not pictured), agree with the replay. In window A, 29 September from 05:56 to 11:45 on the platform clock, the red Bear Power bars are deepest before 06:20 (−9.4 pips at 06:15), and the green Bull Power bars stand above zero from 07:05 to 09:35, with the highest at 09:05 (+8.5 pips, just under the 0.001 mark). In window B, from 11:17 to 17:02, the bars sit mostly under zero until 15:00, with the deepest Bear Power at 14:00 (−14.0 pips), and then the Bull Power rises above zero from 15:05 to its peak of +15.2 pips at 15:15, under the 0.002 mark, and shrinks again. The replay of the library script gives these values for the same candles, so the panel’s scale is in price units. (The platform draws the value of a candle at the time the candle closes: the candle that opened at 08:00 sits at the 08:05 mark.)
The three-condition rule, tested
We wrote the conditions as an exact rule on closed candles. A peak of the Bull Power is a local maximum: higher than the candle before and not lower than the candle after. Higher: the EMA is above its value one candle earlier, the latest confirmed Bull Power peak is higher than the one before it, and the Bear Power is below zero and above its value one candle earlier. Lower: the EMA is below its value one candle earlier, the Bull Power is above zero and below its value one candle earlier, and the Bear Power is below its value one candle earlier. The signal comes on the first candle where all three hold. The option opens at the close of that candle. No expiry is given, so the box shows five minutes and fifteen minutes on 5-minute candles, and five minutes on 1-minute candles.
Tested on IQ Option: the three Elder Ray conditions, EUR/USD candles of 29 September to 5 October 2026
| Asset and candles | EUR/USD binary (regular, not OTC): 1,334 five-minute candles (2026-09-29 01:55 to 2026-10-02 20:55 UTC and 2026-10-04 21:00 to 2026-10-05 17:00 UTC); 1,505 one-minute candles (2026-10-02 18:23 to 2026-10-02 20:59 UTC and 2026-10-04 21:01 to 2026-10-05 19:28 UTC). The candles were recorded from IQ Option’s Practice traderoom. The replay places no orders; it only scores the rule on those closed candles, at an 85% payout. |
|---|---|
| Rule tested | The three conditions on closed candles. Higher: the EMA 13 is above its value one candle earlier, the latest confirmed Bull Power peak is higher than the one before it, and the Bear Power is below zero and above its value one candle earlier. Lower: the EMA is below its value one candle earlier, the Bull Power is above zero and below its value one candle earlier, and the Bear Power is below its value one candle earlier. The signal comes on the first candle where all three hold; the option opens at its close; no expiry is given, so the box shows 5 and 15 minutes on 5-minute candles and 5 minutes on 1-minute candles. |
| Signals | Elder Ray with EMA 13, 5-minute, 1 candle: 114 signals (37 Higher, 77 Lower) Elder Ray with EMA 13, 5-minute, 3 candles: 114 signals (37 Higher, 77 Lower) Elder Ray with EMA 13, 1-minute, 5 candles: 132 signals (46 Higher, 86 Lower) |
| Outcomes | Elder Ray with EMA 13, 5-minute, 1 candle: 56 won, 57 lost, 1 tied; 49.6% of the 113 decided trades won; net −$0.08 per $1 staked at 85% (−$0.05 at 91%) Elder Ray with EMA 13, 5-minute, 3 candles: 62 won, 51 lost, 1 tied; 54.9% of the 113 decided trades won; net +$0.01 per $1 staked at 85% (+$0.05 at 91%) Elder Ray with EMA 13, 1-minute, 5 candles: 69 won, 63 lost, 0 tied; 52.3% of the 132 decided trades won; net −$0.03 per $1 staked at 85% (−$0.00 at 91%) |
| Break-even | At an 85% payout a trade needs to win more than 54.1% of its decided trades to break even (1 ÷ 1.85); at 91%, more than 52.4% (1 ÷ 1.91). |
A replay is only a look back at candles recorded on the dates above: it placed no real orders, covers about four and a half days of one pair, and counts overlapping trades as if they were independent. A short test proves nothing about the future, and no profit and no win rate is promised here. IQ Option’s own blog on backtesting says that most strategies need dozens, and often hundreds, of trades before a result means anything.
The rule gave 114 signals on 5-minute candles, 37 Higher and 77 Lower. With a trade of one candle (5 minutes) 56 won and 57 lost (49.6%, with a 95% interval of 41% to 59%); with three candles (15 minutes) 62 won and 51 lost (54.9%, interval 46% to 64%). On 1-minute candles with a 5-minute trade it gave 132 signals and 69 won against 63 (52.3%). Higher trades won 16 of 37 and 18 of 37 at the two expiries, Lower trades 40 of 77 and 44 of 77. The 15-minute result is level with the 54.1% needed at an 85% payout and well inside its margin of error, so the three conditions show no edge.
Pros and Cons of the Elder Ray Index
| Pros | Cons |
|---|---|
| Shows the reach of each candle above and below the average, not only the close. | It lags, like any indicator built on a moving average. |
| Three conditions together with the EMA slope remove many entries against the trend. | The conditions are a judgement about peaks and slopes; two traders can read the same bars differently. |
| One setting, the period of the EMA. | In our test the three-condition rule was close to the break-even rate, not clearly above it. |
Common mistakes
- Reading the bars without the EMA. The slope of the EMA is the first condition for every entry.
- Treating a positive Bear Power as a bug. It simply means the whole candle was above the EMA.
- Counting every peak. Only a confirmed local maximum, known one candle later, can be compared with the one before.
- Trading it alone. Other tools are needed to reduce false signals.
Related guides
- Trading with the EMA and Elder Impulse System
- Classic and hidden divergences and identifying a trend
- Leading and lagging indicators and too many indicators on your chart
- All indicator guides and all strategy guides
Frequently Asked Questions
Q: What is the Elder Ray Index?
A: An indicator of two sets of bars, Bull Power (the high minus a 13-period EMA) and Bear Power (the low minus the same EMA), that measure the strength of buyers and sellers. It is credited to Dr Alexander Elder.
Q: What settings does the Elder Ray Index have on IQ Option?
A: Period 13. The Colors and display tab has colours for the Bull Power and Bear Power bars and for the zero line.
Q: What is Bull Power and Bear Power?
A: Bull Power is the high of the candle minus the EMA of the close, drawn in green. Bear Power is the low minus the EMA, drawn in red.
Q: How is the EMA used with it?
A: The EMA’s slope is the first condition: rising for a long, falling for a short. The Bull Power and Bear Power then have to agree, as described in the section on the rule.
Q: Does the rule work?
A: On 5-minute EUR/USD candles it gave 114 signals with results close to the break-even rate; the numbers are in the tested box.
Q: Can I use the Elder Ray Index on binary options?
A: The platform draws it on any chart. Whether a rule works is something to test on the Practice balance with the expiry you plan to use.

