
Last updated: 8 October 2026. Every screenshot below was recorded on 5 and 8 October 2026 on an IQ Option Practice account registered in Brazil, and nothing was traded with real money. The settings and the way the indicator builds its waves come from the Quadcode Script Library, the public source code of the platform’s built-in indicators. The tested box shows what each of the two strategies, written as an exact rule, did on EUR/USD 5-minute candles recorded from 29 September to 5 October 2026; it says nothing about what they will do next.
Weis Wave Volume adds up the volume of each price wave and draws it as a bar that grows while the wave continues, green for an up wave and red for a down wave. The bar is a running total, so a longer wave has a bigger bar, and the colour shows the direction of the last brick-sized move, not a verdict on the trend. This guide covers two strategies that pair the colour with a 30-period EMA and with Heikin Ashi candles; each is written as an exact rule, and the tested box shows what each did on EUR/USD 5-minute candles from 29 September to 5 October 2026.
Quick answer
- What it shows: volume added up wave by wave. A bar grows while price keeps moving one way and starts again when the direction turns: green for up waves, red for down waves.
- What the colour means: the direction of the indicator’s last brick-sized move (a Renko-style filter), not a trend call. The bar is a running total, so a longer wave is taller.
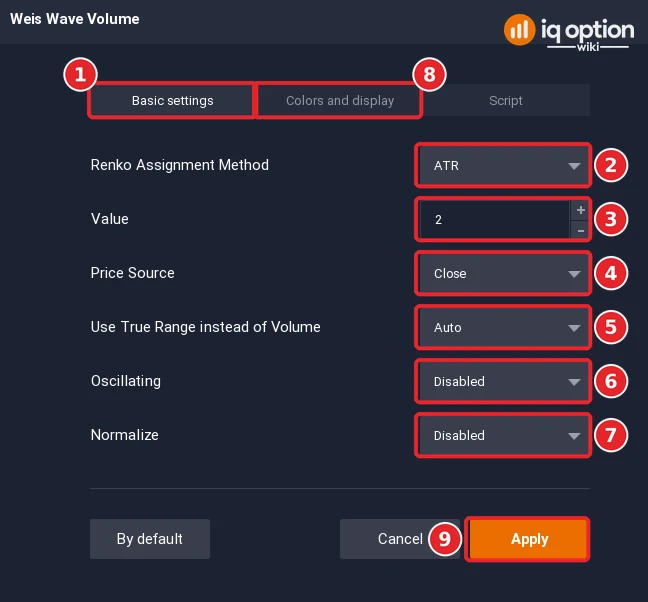
- Source-code defaults: Renko method ATR, Value 2, Price Source Close, Use True Range instead of Volume Auto, Oscillating off, Normalize off.
- Where it is: indicators button, Chart analysis, Volume list, Weis Wave Volume. It opens in its own panel under the price chart.
- Two strategies: the bar colour with a 30-period EMA, and with Heikin Ashi candles, both written as exact rules for 5-minute candles with a 15-minute expiry. Neither is claimed to work.
- Tested: on EUR/USD 5-minute candles from 29 September to 5 October 2026, rule 1 (EMA 30) had 82 signals and won 40 of its 81 decided trades (49.4%), and rule 2 (Heikin Ashi, with the indicator calculated on the Heikin Ashi candles as the platform does) had 69 signals and won 42 (60.9%), against a break-even rate of 54.1% at an 85% payout. It is a short replay and says nothing about the future. With 69 trades the win rate has a margin of error of about ±6 points (one standard error), so 60.9% cannot be told from break-even.
What is Weis Wave Volume?
Weis Wave Volume (WWV) is a volume-based indicator that shows volume in cumulative form, wave by wave. IQ Option’s blog says it “takes volume and organizes it into wave charts”, giving a series of selling and buying waves, and that it helps traders “to better see the connection between the price action and volume”. The same blog calls it arguably the most complex of the platform’s four volume indicators. IQ Option does not say what its volume series counts for forex assets. We looked in the blog and Help pages we saved for this guide: the blog describes volume as “a measure of how much the asset is being traded at a particular moment in time”, and another article of the same blog warns that the volume on a retail chart “may represent ticks or activity from a particular data source, not all global FX trading”.
In the Quadcode source the indicator works like this. It follows the price source, by default the close, with a Renko-style filter. It keeps a reference price and a “brick”, the smallest move that counts. When the price source moves more than one brick above the reference, the wave is up and the reference moves to the new price; when it moves more than one brick below, the wave is down and the reference moves there. Smaller moves change nothing. While the wave keeps its direction, each candle’s volume is added to the wave’s total, and the bar for that candle is as tall as the total so far. When the direction turns, the total starts again from that candle’s volume and the bar changes colour. The panel therefore shows rising runs of green or red bars, each run ending where the colour flips, and the last bar of a run is the wave’s total.
The brick depends on the settings. With the default method, ATR, and a Value of 2, the brick is a smoothed average of the true range over about the last two candles, so it is about the size of a recent candle. The colour is therefore not a trend call: it says that price has moved more than a brick one way since the reference point, and a counter-move of roughly one or two bricks, which on the default settings means one or two candle ranges, turns it.
| Setting | Source-code default | What it does |
|---|---|---|
| Renko Assignment Method | ATR | How the brick is set: ATR uses an average true range, Traditional a fixed price distance, Part of Price a fraction of the price |
| Value | 2 | The number the method uses: the ATR length in candles, the brick in price units, or the number the close is divided by |
| Price Source | Close | Which price moves the reference: the close, the candle body (Open / Close) or the full range (High / Low) |
| Use True Range instead of Volume | Auto | Always adds up true range, Never adds up volume, Auto adds up volume and falls back to true range when the asset has no volume |
| Oscillating | Off | When on, down waves are drawn below the zero line instead of above it |
| Normalize | Off | When on, each bar shows the average volume per candle in the wave so far instead of the total |
| Bar Colors | green up, red down | The colours of up and down waves |
Value means something different for each method, a number of candles for ATR, a price distance for Traditional and a divisor for Part of Price, so change the method and the Value together.
Read the panel in waves. Each run of one colour is a wave, and its last bar is the wave’s total. Because the total grows with every candle, a longer wave ends taller than a shorter one, so compare waves of similar length, or switch Normalize on to compare the average volume per candle. If the asset has no volume data, the Auto setting adds up true range instead, and the bars then show cumulative price range, not volume. Every EUR/USD candle we recorded carries a volume value (from 170 to 8,003 on 5-minute candles), and the chart’s candle tooltip shows it as Vol., so on that asset Auto adds up volume. We did not test an asset without volume, so we cannot say what the panel shows there.
Setting the IQ Option chart
These steps use the web traderoom on a Practice balance. The numbers in each screenshot match the numbers in the text.
Step 1: Open Chart analysis
Click the indicators button (1), the wave icon in the chart toolbar at the bottom left of the chart. The Chart analysis panel opens with the tabs Indicators, Templates, Widgets and Scripts.

Step 2: Find Weis Wave Volume
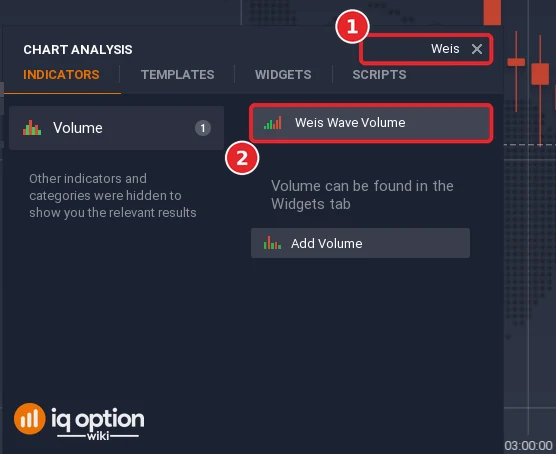
On the Indicators tab, type “Weis” in the Search for indicators box (1) and click Weis Wave Volume (2). The search narrows the list to the Volume group, which holds IQ Option’s four volume indicators. The indicator’s dialog opens with three tabs, Basic settings, Colors and display and Script.
Step 3: Check the settings and apply
The dialog opens on Basic settings (1). The Renko Assignment Method (2), Value (3), Price Source (4), Use True Range instead of Volume (5), Oscillating (6) and Normalize (7) show the defaults from the table above (on the platform: ATR, 2, Close, Auto, Disabled and Disabled; Oscillating and Normalize are drop-down lists that read Disabled). Keep them for the two strategies below. Colors and display (8) holds the colours of up and down waves. Click Apply (9).
Step 4: Read the panel
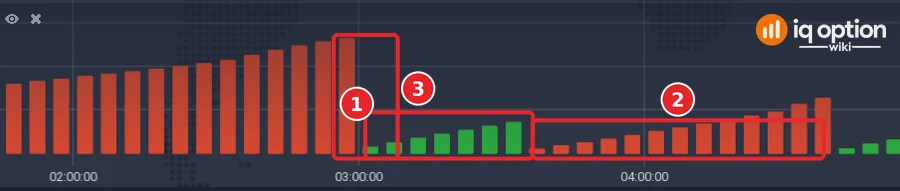
The indicator opens in its own panel under the price chart (its label reads WWV (ATR,2,Close,Auto,false,false), with a gear, an eye and a cross beside it). Runs of green bars (1) are up waves and runs of red bars (2) are down waves. Where the colour flips (3), the previous wave ends and the next total starts again from one candle.
Step 5: Add the 30-period EMA
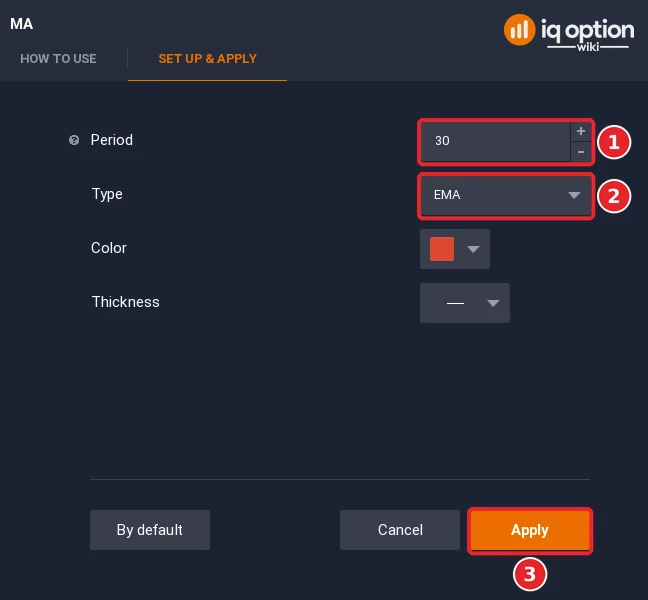
For the first strategy, add a Moving Average: type “Moving Average” in the search box and click Moving Average. The dialog has two tabs, How to use and Set up & apply, and opens on Set up & apply. Set Period to 30 (1) and Type to EMA (2), then click Apply (3). The default period is 14 and the default type is SMA, so both have to be changed.
Step 6: Switch to Heikin Ashi candles
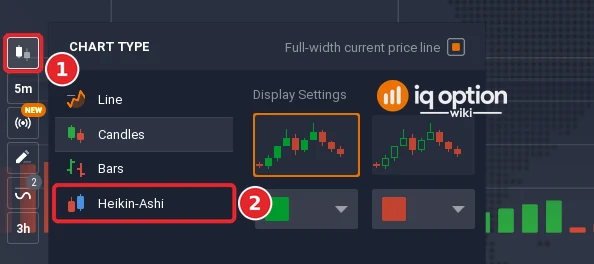
For the second strategy, click the chart type button (1) in the toolbar and choose Heikin Ashi (2), which the list spells Heikin-Ashi. The list also offers Line, Candles and Bars. The candles turn light blue when the Heikin Ashi candle closes above its open and stay red when it closes below it. Once Heikin-Ashi is chosen, the Weis Wave Volume panel is drawn from the Heikin Ashi candles, not from the real ones: on the same stretch of 29 September the green and red runs differ between the two chart types. On the candle chart the green wave ran from 03:00 to 03:30 platform time and the next red wave started at 03:35; on the Heikin Ashi chart the green wave ran from 03:05 to 04:10 and the red wave that followed started at 04:15. Our replay of the indicator on Heikin Ashi values gives the Heikin Ashi colours, and on real candles it gives the candle ones.
Step 7: Set 5-minute candles
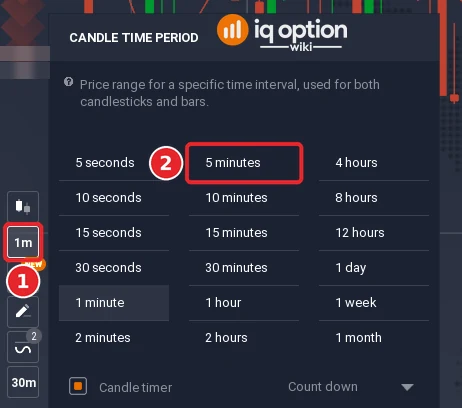
Click the candle time period button (1) in the toolbar and choose 5 minutes (2). Both strategies below are written for 5-minute candles.
Using the Weis Wave Volume indicator in trading
Each strategy is written below as an exact rule, with its candle size and expiry, and where a reading had to be chosen the choice is stated. Neither rule has been shown to work; the tested box after the examples says only what each did on one week of candles.
Weis Wave Volume simple strategy with EMA
The first strategy pairs the colour of the Weis Wave Volume bar with a 30-period exponential moving average (Step 5). The idea is that a cross of the EMA marks a possible new trend and the WWV colour confirms its direction. The rule as we read it, on 5-minute candles:
- Higher: a candle closes above the EMA(30) after the previous candle closed at or below it, and the Weis Wave Volume bar on that candle is green.
- Lower: a candle closes below the EMA(30) after the previous candle closed at or above it, and the bar is red.
- Expiry: 3 candles (15 minutes) from the close of the signal candle.
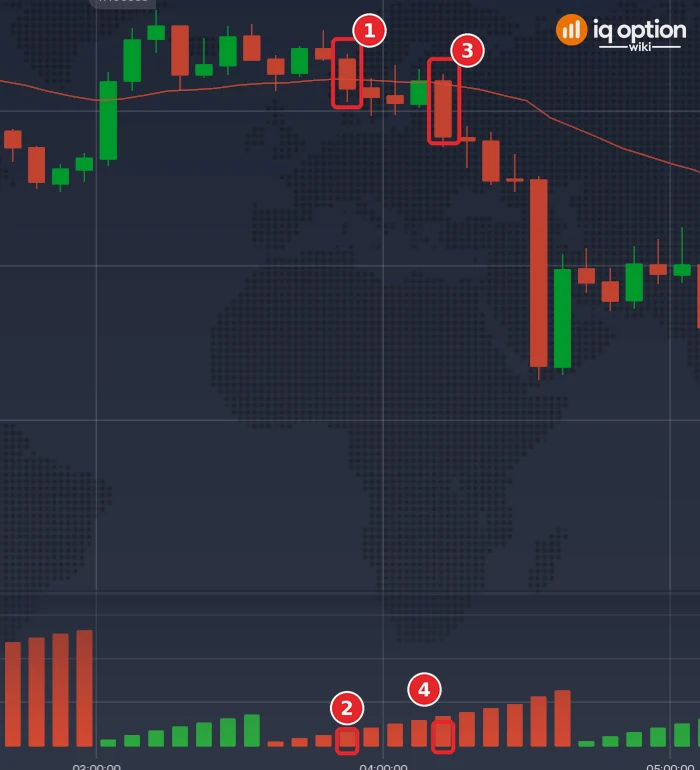
The rule needs the bar to have the matching colour on the signal candle, because the WWV is there to confirm the cross. A stricter reading, in which the colour must also flip on the signal candle, would give fewer signals. The first two signals of the recorded series were both Lower. On EUR/USD 5-minute candles, the candle that opened at 03:50 on 29 September 2026 on the platform clock (06:50 UTC) closed under the EMA(30) after the candle before it had closed above it, and the Weis Wave Volume bar on it was red (1 and 2). In a replay of the recorded candles the entry was 1.136145 at its close and the option expired 15 minutes later at 1.136195, so the Lower option lost. The second signal, on the candle that opened at 04:10 (07:10 UTC), is marked (3) and (4): entry 1.135835, expiry 1.13555, a win. The test below counts every signal, not these two.
Weis Wave Volume simple strategy with Heikin Ashi
The second strategy uses Heikin Ashi candles (Step 6) on a 5-minute chart (Step 7). Heikin Ashi candles are built from averaged prices, and IQ Option’s blog says the chart “might be slower to react to changes in trend or momentum”, so its colour trails the real price. The rule as we read it:
- Higher: the Weis Wave Volume bar turns from red to green on a candle that closes bullish on the Heikin Ashi chart, with its close above its open. On the platform the bullish candles are light blue.
- Lower: the bar turns from green to red on a candle that closes bearish on the Heikin Ashi chart. On the platform the bearish candles are red.
- Expiry: 3 candles (15 minutes) from the close of the signal candle. A binary option has a fixed expiry, so the rule has to name one.
On a Heikin Ashi chart the platform calculates the Weis Wave Volume from the Heikin Ashi candles, not from the real prices (see Step 6; this rests on our own recording and not on a statement by IQ Option), so the rule below uses the Weis Wave Volume as the Heikin Ashi chart draws it. The test box also reports the version that uses the real candles.
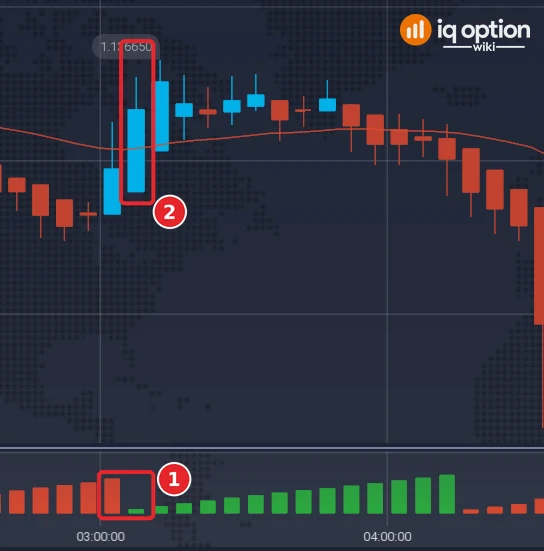
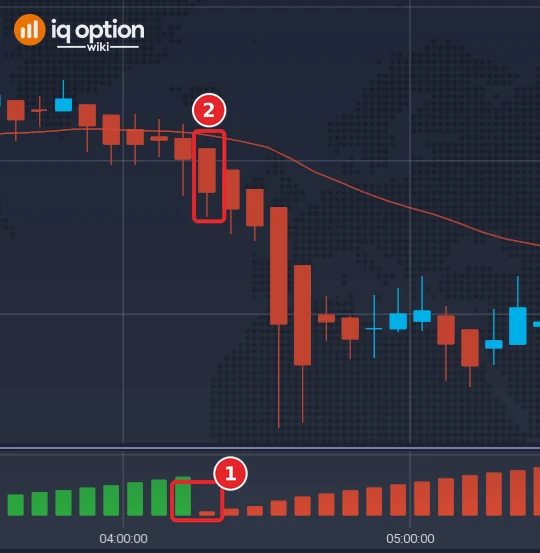
The first two signals of the recorded series came on the Heikin Ashi chart. On the candle that opened at 03:05 on 29 September 2026 on the platform clock (06:05 UTC) the bar turned from red to green (1) under a bullish Heikin Ashi candle (2): a Higher signal. The entry was 1.13646 at the real close and the option expired 15 minutes later at 1.1363, so it lost. The next signal, a Lower on the candle that opened at 04:15 (07:15 UTC), is shown in the second image: the bar turned from green to red (1) under a bearish Heikin Ashi candle (2), the entry was 1.13581 and the expiry 1.13435, a win.
Tested on IQ Option: EUR/USD candles of 29 September to 5 October 2026
| Asset and candles | EUR/USD (binary), 5-minute candles recorded from IQ Option’s Practice traderoom: 1,334 candles in two stretches without gaps, 29 September 01:55 (open of the first candle) to 2 October 21:00 UTC (close of the last candle; 1,093 candles in this stretch) and 4 October 21:00 to 5 October 17:05 UTC (241 candles). The first 50 candles of each stretch are skipped as indicator warm-up, so 1,234 candles were scanned. The replay places no orders and uses the logged prices and volumes. |
|---|---|
| Rule 1: WWV and EMA(30) | 5-minute candles, Weis Wave Volume at its source-code defaults and an EMA of the close with period 30. Higher when a candle closes above the EMA after the previous candle closed at or below it and the Weis Wave Volume bar on that candle is green; Lower for the mirror case with a red bar. Opened at the close of the signal candle, expiring 3 candles (15 minutes) later. |
| Rule 2: WWV and Heikin Ashi | 5-minute Heikin Ashi candles, Weis Wave Volume at its source-code defaults, calculated on the Heikin Ashi candles as the platform does when the chart type is Heikin-Ashi. Higher when the bar turns from red to green on a candle that closes bullish (Heikin Ashi close above its open); Lower when it turns from green to red on a bearish candle. Opened at the close of the signal candle (the real close), expiring 3 candles (15 minutes) later. |
| Signals and outcomes, rule 1 | 82 signals: 40 won, 41 lost, 1 refunded. Win rate among decided trades 49.4% (40 of 81); net -$0.085 per $1 staked at an 85% payout. Alternative readings run as well: with the colour also required to flip on the signal candle, 28 signals, 17 won, 11 lost (60.7%); with a 6-candle (30-minute) expiry, 49 won, 32 lost, 1 refunded (60.5%). With about 80 decided trades, chance alone can move a win rate by more than ten percentage points, so none of these differences shows that one reading is better. |
| Signals and outcomes, rule 2 | 69 signals: 42 won, 27 lost, none refunded. Win rate 60.9% (42 of 69); net +$0.126 per $1 staked at an 85% payout. Alternative readings run as well: with the Weis Wave Volume calculated on the real candles instead, 118 signals, 68 won, 50 lost (57.6%); with a 6-candle (30-minute) expiry, 35 won and 34 lost on the Heikin Ashi calculation (50.7%) and 64 won and 54 lost on the real-candle one (54.2%). The replay opens an order for every signal, so orders can overlap in time. With 69 decided trades, chance alone can move a win rate by more than ten percentage points. |
| Break-even | At an 85% payout a trade needs to win more than 54% of the time to break even (1 ÷ 1.85); at 87%, about 53.5%. |
This test replays candles recorded from IQ Option’s Practice traderoom between 29 September and 5 October 2026. It placed no real orders, and one week of EUR/USD candles proves nothing about how either rule will behave next. A win rate above the break-even rate over this many trades can happen by chance. No profit or win rate is promised. If you read the wording differently, your result will differ.
WWV Indicator Combinations
| Combination | Higher | Lower | Candles and expiry |
|---|---|---|---|
| WWV and EMA(30) | Close crosses above the EMA(30) and the bar is green | Close crosses below the EMA(30) and the bar is red | 5-minute candles, 3 candles |
| WWV and Heikin Ashi | Bar turns from red to green on a bullish Heikin Ashi candle | Bar turns from green to red on a bearish Heikin Ashi candle | 5-minute Heikin Ashi candles, 3 candles |
Pros and Cons of Using Weis Wave Volume Indicator
| Pros | Cons |
|---|---|
| It shows how much volume each up wave and each down wave carried, in one panel. | The waves depend on the settings; the same chart gives different waves with a different method or Value. |
| The settings let you choose what ends a wave: an ATR, a fixed price distance or a fraction of the price. | The bar is a running total, so waves of different length are not directly comparable unless Normalize is on. |
| It is built into the Volume list; nothing has to be imported. | It needs volume data to say anything about volume, which on forex may count ticks or one data source’s activity (IQ Option’s blog). |
Common mistakes
- Reading green as “the trend is up”. Green means the last brick-sized move was up; a small counter-move can turn it.
- Comparing bars from waves of different length. A longer wave always ends taller unless Normalize is on.
- Changing the method and leaving Value alone. Value is a number of candles for ATR and a price distance for Traditional.
- Reading true-range bars as volume. On Auto, an asset without volume data is drawn from true range.
Summary
Weis Wave Volume turns volume into a wave-by-wave total, coloured by the direction of the last brick-sized move. Check what ends a wave in your settings, compare waves of similar length and read the colour as a direction, not a forecast. Test the two strategies on a Practice balance over a few hundred trades and compare your win rate with the break-even rate (more than 54% at an 85% payout) before you risk money.
Related guides
- How to read trading volume on IQ Option
- Volume Oscillator and Net Volume on IQ Option
- Accumulation/Distribution on IQ Option
- Heikin Ashi candles on IQ Option
- How to trade with the EMA indicator on IQ Option
- Chart types on IQ Option
- Identifying a trend on IQ Option
- All indicator guides and all strategy guides
Frequently Asked Questions
Q: What is Weis Wave Volume?
A: A volume indicator that adds up volume wave by wave. The bar grows while price keeps moving in one direction and starts again when the direction turns, green for up waves and red for down waves.
Q: What does the colour of the bars mean?
A: Green means the indicator’s last brick-sized move was up and red that it was down. The brick is set by the Renko Assignment Method and Value settings. The colour is not a trend call.
Q: Which settings should I change?
A: The source-code defaults are ATR, a Value of 2, the close as the price source, Use True Range instead of Volume on Auto, and Oscillating and Normalize off. Change the method and the Value together, because Value means something different for each method.
Q: Can I use it on different candle sizes?
A: It is calculated on the candles the chart shows, so the waves change when you change the candle size. The two strategies here are written for 5-minute candles.
Q: Do the two strategies work?
A: Neither has been shown to work. The tested box shows what each did on EUR/USD 5-minute candles from 29 September to 5 October 2026, and a short test proves nothing about the future. A trade needs to win more than 54% of the time at an 85% payout to break even.
Q: Does it need volume data?
A: To show volume, yes. With Use True Range instead of Volume on Auto, it falls back to true range when the asset has no volume. Every EUR/USD candle we recorded carries a volume value (from 170 to 8,003 on 5-minute candles), and the chart’s candle tooltip shows it as Vol., so on that asset Auto adds up volume. We did not test an asset without volume, so we cannot say what the panel shows there.
Q: Should I use it alone?
A: IQ Option’s blog says volume should not be treated as a decision-making tool on its own. Both strategies here add a second condition to the colour.

