
Last updated: 8 October 2026. Every screenshot below was recorded on 8 October 2026 on an IQ Option Practice account registered in Brazil, on EUR/USD 5-minute candles; the Chart analysis picture in Step 1 was recorded on 5 October 2026. We placed no real-money trade. Both script files are those of the IQ Option Scripts Library, imported unchanged. The tested box shows how their markers did on EUR/USD candles recorded between 29 September and 5 October 2026; it says nothing about what will happen next.
IQ Wiki Signals V1.1.0 is two free scripts for the IQ Option chart that read the chart you have open and mark a completed candle. IQ_WIKI_SCRIP_V1.1.0 (“Regular Signals”) adds up points from RSI, MACD, Bollinger Bands and candle patterns and draws HIGHER or LOWER; IQ_WIKI_BINARY_SIGNAL_GUN_V1.1.0 is stricter: at least two indicator families must agree, and it draws CALL, PUT, or a large GUN+ marker. Import them in Chart analysis, Scripts, Import script, then click the plus button; neither places orders. We replayed both on 1,334 five-minute EUR/USD candles: Regular Signals drew 109 markers and 5-minute trades won 46.3% of the decided trades, the Signal Gun drew 148 and won 46.9%, both below the 54.1% needed to break even at an 85% payout.
Quick answer
- Files: IQ_WIKI_SCRIP_V1.1.0 (Regular Signals) and IQ_WIKI_BINARY_SIGNAL_GUN_V1.1.0 (Signal Gun), two independent .lua scripts under the MIT licence.
- Regular Signals: a green HIGHER triangle under a candle or a red LOWER triangle over it, when the points of RSI, MACD, Bollinger and patterns reach a score of 2 and a quality of 3.
- Signal Gun: CALL (green) or PUT (red) when two or more families agree and the confluence reaches 65; a large GUN+ CALL (blue) or GUN+ PUT (orange) at 80 or more.
- Install: Chart analysis, Scripts tab, Import script, choose the file, then the plus button under the editor; add one script at a time.
- Timing: a marker is drawn on the qualifying candle and becomes available when the next candle begins; neither script places orders or sets an expiry.
- Tested: Regular Signals, 109 markers, 5-minute trades won 46.3% of the decided trades; Signal Gun, 148 markers, 46.9%; break-even is 54.1% at an 85% payout.
Download the two .lua files
They share indicators but answer different questions. Import them separately, so that each chart label stays easy to read; you can use one or both.
Reviewed plain-text source
IQ_WIKI_SCRIP_V1.1.0: the download and the source preview in the library are the same SHA-256-pinned file.
SHA-256: 98702b0378074204ac968a550dd76d477bf1b1bebe0888ca1b301c8db3755855Reviewed plain-text source
IQ_WIKI_BINARY_SIGNAL_GUN_V1.1.0: the download and the source preview in the library are the same SHA-256-pinned file.
SHA-256: eff4e7b1ce463aa2d5a96a7bf75e5b800dbdd916c59a3e347029dff443fbe9b1How do you install the two scripts on IQ Option?
Set the chart
Choose the asset, the chart type and the candle size first: the script is calculated from the candles on the chart. The examples in this guide use 5-minute candles on EUR/USD. These steps use the web traderoom on a Practice balance, and the numbers in each screenshot match the numbers in the text. If you do not have an account yet, see how to register.
Step 1: Open Chart analysis
Click the indicators button (1), the wave icon in the chart toolbar at the bottom left of the chart. The Chart analysis panel opens with the tabs Indicators, Templates, Widgets and Scripts. The next step opens the Scripts tab.

Step 2: Open the Scripts tab
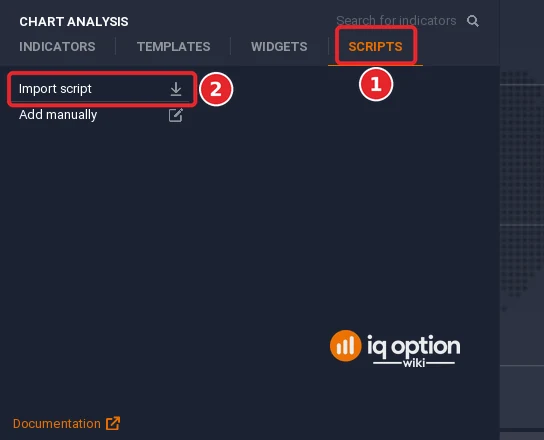
Click the Scripts tab (1) of the Chart analysis panel and then Import script (2). Your browser opens a file window.
Step 3: Import the files
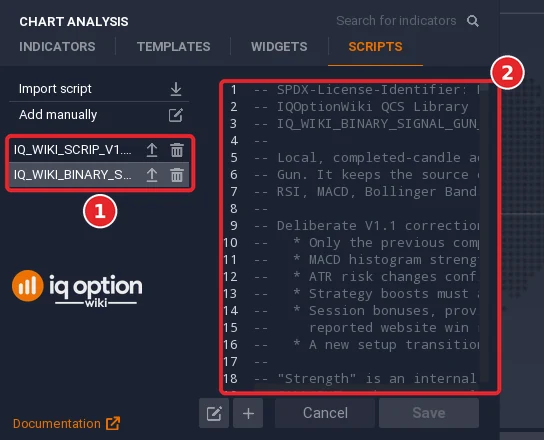
Choose IQ_WIKI_SCRIP_V1.1.0.lua. The script appears as a row of the list, named IQ_WIKI_SCRIP_V1.1.0, and its code opens in the editor on the right. Click Import script again and choose IQ_WIKI_BINARY_SIGNAL_GUN_V1.1.0.lua: it becomes a second row. The two rows (1) stand one under the other, and the editor shows the code of the file imported last (2). Both files compiled without an error message.
Step 4: Add one script to the chart
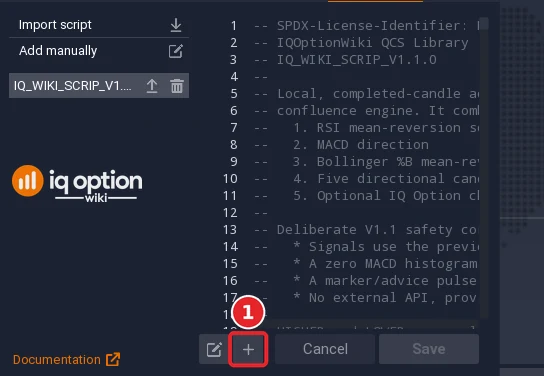
The plus button (1) under the editor adds the script whose code is open to the chart. Add one script at a time: both draw Bollinger lines in the same place, and their markers are easier to tell apart alone. Close the panel with Escape to see the chart.
Step 5: Look at Regular Signals on the chart
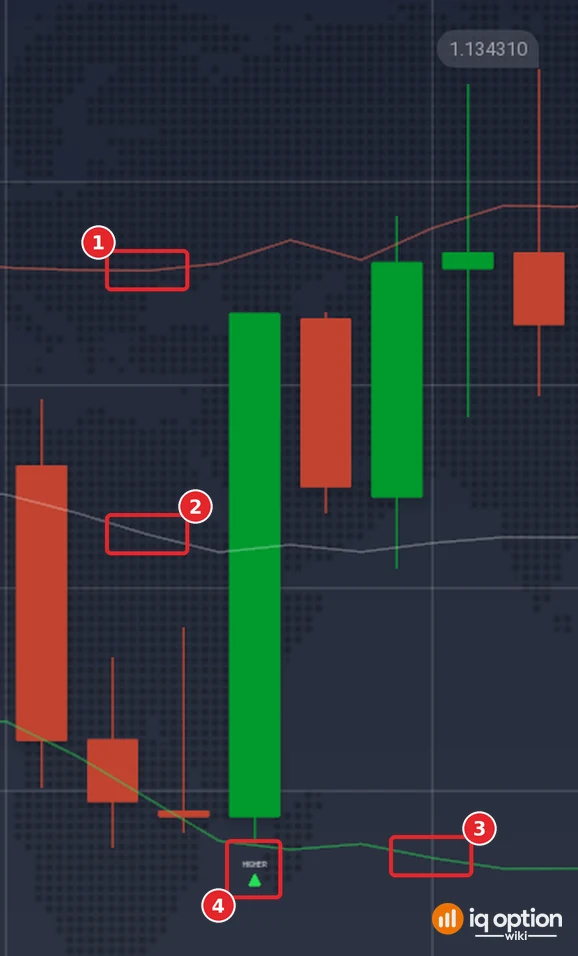
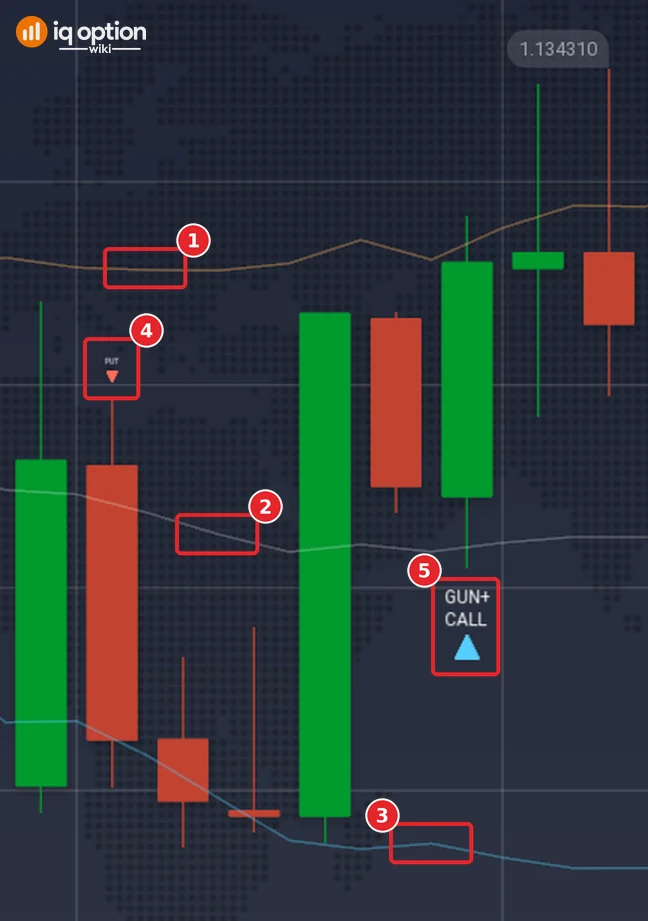
IQ_WIKI_SCRIP_V1.1.0 draws three Bollinger lines: the red upper line (1), the grey middle line (2) and the green lower line (3). A green HIGHER triangle under a candle (4) or a red LOWER triangle over a candle is the marker. Most candles have none.
Step 6: Look at the Signal Gun on the chart
IQ_WIKI_BINARY_SIGNAL_GUN_V1.1.0 draws the same three Bollinger lines in other colours: orange on top (1), grey in the middle (2) and blue underneath (3). Its markers are a small green CALL triangle under a candle or a small red PUT triangle over one (4), and a large GUN+ CALL (blue) or GUN+ PUT (orange) triangle (5) when the stricter alignment is met.
Step 7: Read the settings of Regular Signals
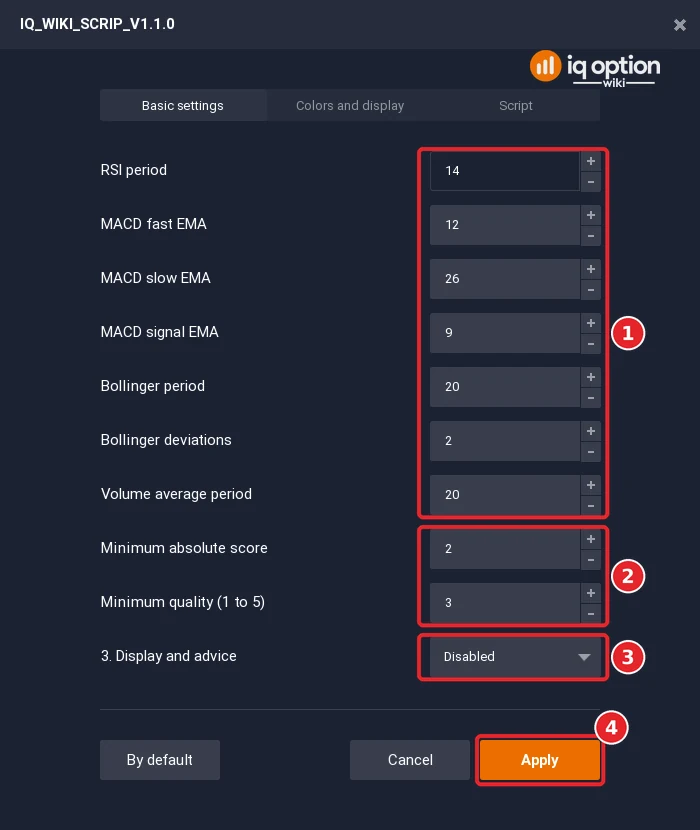
Open Chart analysis, Indicators, Added, and click the gear of the script. The Basic settings tab lists nine numbers and a list. The first seven (1) are the engine: the RSI period, the three MACD periods, the Bollinger period and deviation, and the period of the volume average. The next two (2) are the signal gate: the minimum absolute score and the minimum quality. The last row (3) is the list called Display and advice, set to Disabled; Apply (4) redraws the chart.
Step 8: Know what Display and advice does
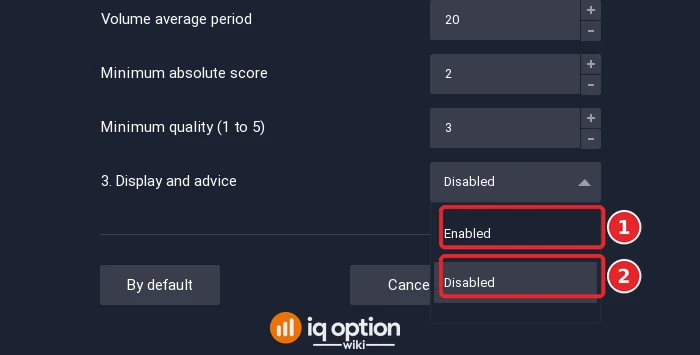
The list Display and advice offers Enabled (1) and Disabled (2). Disabled is the default; the next sections explain what Enabled switches on. Leave it on Disabled for the first run.
Step 9: Read the settings of the Signal Gun
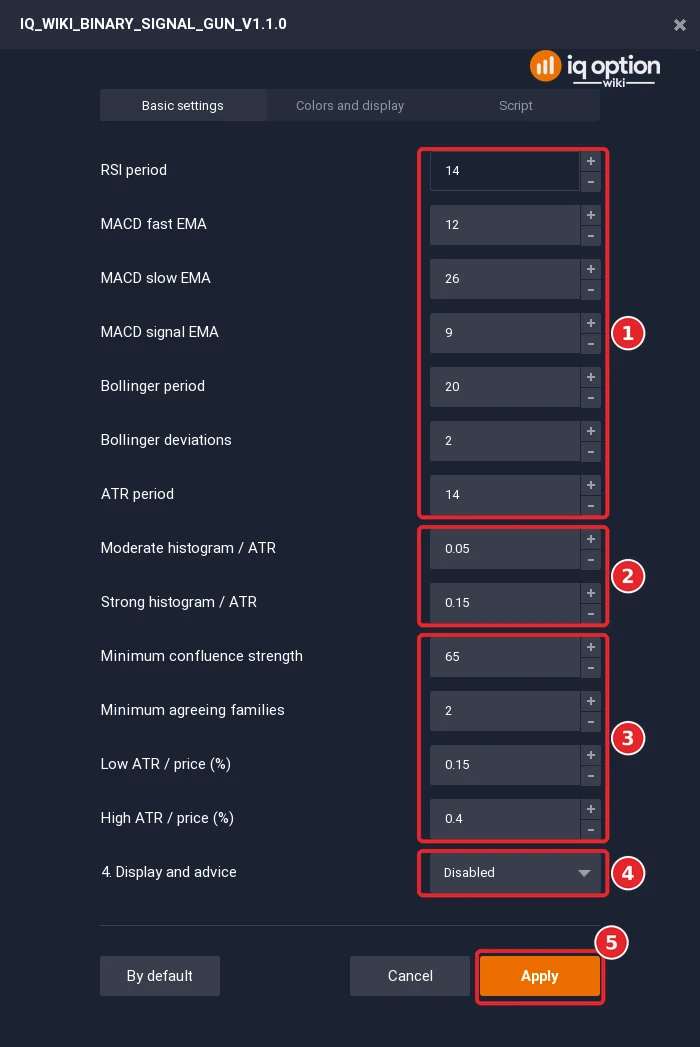
The Signal Gun has 14 rows. The first seven (1) are the indicators: RSI, MACD, Bollinger and ATR periods. Two (2) set the MACD limits as fractions of ATR. Four (3) set the confluence: the minimum strength (65), the minimum number of agreeing families (2) and the low and high ATR-to-price percentages. The last row (4) is Display and advice, and Apply (5) redraws the chart. The list scrolls, and the picture joins its top and its end.
Which script should you choose?
They share indicators but answer different questions. Test each one by itself first.
| | Regular Signals V1.1.0 | Binary Signal Gun V1.1.0 | |
|---|---|---|
| Suited to | A transparent weighted score that resembles the regular Signals cards. | A stricter vote-and-strength gate with at least two agreeing indicator families. |
| Markers | HIGHER or LOWER. | CALL, PUT, GUN+ CALL or GUN+ PUT. |
| Logic | RSI, MACD, Bollinger %B and a candle-pattern score, multiplied by the chart volume when there is any. | Weighted RSI, MACD measured in ATR, Bollinger and pattern families. |
| Default gate | Absolute score of at least 2 and quality of at least 3. | At least two agreeing families and a confluence strength of at least 65. |
| Volume | Can strengthen or weaken the score; missing or zero volume counts as neutral. | Not used. |
You can show both scripts, but their Bollinger lines overlap, and the advice of only one of them should be switched on at a time, so that its state is unambiguous.
On 29 September both scripts marked the same candles in our recording: the candles that closed at 16:05 and 16:20 (HIGHER and CALL) and at 17:00 and 17:10 (LOWER and GUN+ PUT). That does not mean they always agree: the Signal Gun drew 148 markers in the replay and Regular Signals 109.
How does Regular Signals score a candle?
The script gives bullish or bearish points to four families, then lets the chart volume change the total. A positive score that passes the gates becomes HIGHER, a negative one LOWER. A score that cancels to zero stays neutral.
| Family | Bullish points | Bearish points | In plain words |
|---|---|---|---|
| RSI 14 | +1 at 30 or lower; +2 at 20 or lower. | -1 at 70 or higher; -2 at 80 or higher. | Looks for stretched momentum, to bet on a turn. |
| MACD 12, 26, 9 | +2 when the histogram is positive. | -2 when the histogram is negative. | Gives the momentum direction; exactly zero is neutral. |
| Bollinger %B (20, 2) | +1 at 0.2 or lower; +2 at 0 or lower. | -1 at 0.8 or higher; -2 at 1 or higher. | Reads the close inside the bands as a turn signal: near the upper band is bearish. |
| Candle patterns | Bullish engulfing +1.5, morning star +2, hammer +1.5, bullish harami +1. | Bearish engulfing -1.5, evening star -2, bearish harami -1. | Five directional patterns; a plain doji adds nothing. |
The chart volume then changes the total: it is multiplied by 1.5 when the candle’s volume is 2 times its 20-candle average or more, by 1.25 at 1.5 times, and by 0.75 at half the average or less. Missing volume does not block a signal.
The default gate is a volume-adjusted score of at least 2 and a quality of at least 3. Quality grows with the size of the score, with the number of agreeing families and with the volume, on a scale from 1 to 5. The script plots its three Bollinger lines for context.
How does the Binary Signal Gun vote?
The Signal Gun gives each directional family a weight. A direction needs the heavier side and at least two agreeing families, and then a confluence value from 0 to 100.
| Family | Weight | Direction rule |
|---|---|---|
| RSI | 4, 8 or 10 | More weight as RSI moves through 60, 70 and 75 (bearish) or 40, 30 and 25 (bullish). |
| MACD | 7 or 9 | The histogram direction, but only once its size passes 0.05 of ATR; above 0.15 of ATR it counts as strong. |
| Bollinger | 3 or 7 | A mean-reversion vote near or beyond the upper or lower band. |
| Candle patterns | 10 | One bullish or bearish family vote when the detected patterns do not conflict. |
The base value is 40% agreement, 35% weighted strength and 25% family coverage. The ratio of ATR to price then adds 3 in the low-volatility zone (below 0.15%) or takes 8 off in the high one (above 0.40%); these boundaries are settings, not market constants.
- CALL or PUT: at least two families agree and the confluence reaches 65.
- GUN+ CALL or GUN+ PUT: the base signal passed, a reversal, breakout, trend or momentum rule agrees with its direction, and the displayed setup strength reaches 80.
- No marker: one family alone, a tied score or a value below the threshold stays neutral.
65 and 80 are rule thresholds, not measured win probabilities. The Signals website has displayed confidence much higher than its observed decided-result rate, so this script calls the number internal confluence or setup strength.
What does V1.1.0 change from the Signals website?
This is a local adaptation, not a copy. The source audit found behaviours that should not be reproduced inside a chart indicator.
- Open-candle repaint: the web services can evaluate their newest candle while it forms. V1.1.0 waits for the IQ Option candle to close.
- Repeated scans: the services do not skip a candle that was already marked. V1.1.0 draws a marker only when a setup changes from false to true.
- MACD scale: the web Signal Gun uses absolute histogram limits. V1.1.0 divides the histogram by ATR.
- ATR counted twice: the source Signal Gun can let ATR change both the direction score and the confidence. V1.1.0 applies the risk adjustment once.
- Contradicting boosts: a breakout label can disagree with the Bollinger reversal vote. V1.1.0 lets the strategy alignment raise the strength only when it matches the final direction; it cannot create or reverse a signal.
- Bollinger formula: the Quadcode language computes a sample standard deviation and the service a population one; V1.1.0 applies the exact correction.
- Session bonus: fixed UTC session bonuses, external caches and website timers are left out.
When does a marker appear, and when can you act on it?
- Candle N-1: the setup is false.
- Candle N: the setup becomes true. The script lets the candle finish, so a spike, a reversal or a volume change in the open candle cannot create a marker.
- Candle N+1 begins: the script sees the completed setup and draws the marker one candle back, on candle N.
A marker on a chart you scroll through is not an earlier signal: it only becomes available when candle N+1 begins, which is also the earliest a trade can open, at the close of candle N. If the setup stays true for several candles, the marker does not repeat until it has been false and turned true again.
What does Enabled do in Display and advice?
The list is Disabled by default. When it is Enabled, the script sets the advice state of the Quadcode script language to buy, sell or neutral from the same completed setup that draws the marker. Quadcode describes advice as a notification state: it is not an order, a webhook, a custom message, a Telegram connection or an expiry timer. With the list Disabled, with no new setup, or when the directions conflict, the state is neutral.
We set the list of IQ_WIKI_SCRIP_V1.1.0 to Enabled on the Practice chart and applied it. The chart and the Widgets tab looked the same as before, and we found no place in the web traderoom that shows the advice state; the market was closed during that test, so the newest candle could not produce a new setup. Switch advice on in only one of the two scripts at a time.
Four markers of the recording, step by step
The pictures use a stretch of 29 September in which the Bollinger lines run close to the candles, which makes the markers easy to see; we did not choose by outcome, and the next section counts every marker. All times are the platform clock, which is UTC minus three hours.
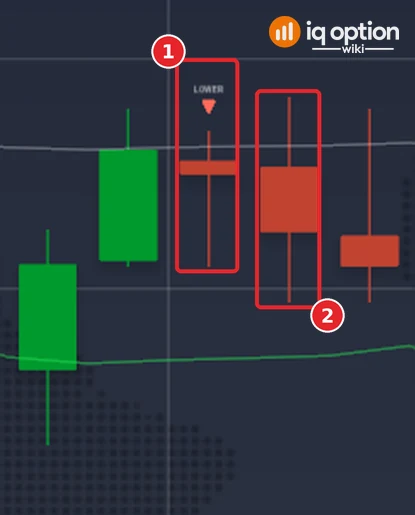
Regular Signals: LOWER at 21:35
The candle (1) that opened at 21:30 and closed at 21:35 at 1.1339 scored -3.0. The MACD histogram was negative, -2, and the candle formed a bearish harami, -1; RSI at 47.7 and %B at 0.44 added nothing, and the volume was 1.26 times its average of 20 candles, below the 1.5 times that changes the score. A score of -3.0 gives a quality of 3.0, which passes the gate of 2 and 3, and the candle before had not passed, so LOWER was drawn. A Lower trade opened at that close ended at 21:40, when the next candle (2) closed at 1.13385, 0.5 pip lower: it won.
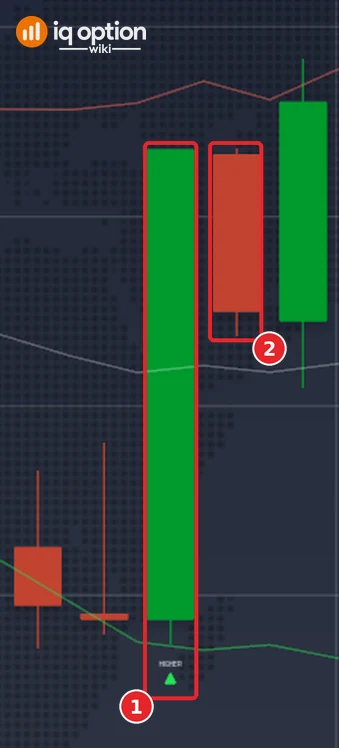
Regular Signals: HIGHER at 22:20
The candle (1) that opened at 22:15 and closed at 22:20 at 1.13407 scored +4.5 before volume: the MACD histogram was positive, +2; a bullish engulfing and a morning star added +3.5; %B at 0.88 took 1 off. The volume was 1.55 times its average, so the total was multiplied by 1.25 to 5.6, and the quality came to 4.5. A Higher trade opened at that close ended at 22:25, when the next candle (2) closed at 1.1339, 1.7 pips lower: it lost.
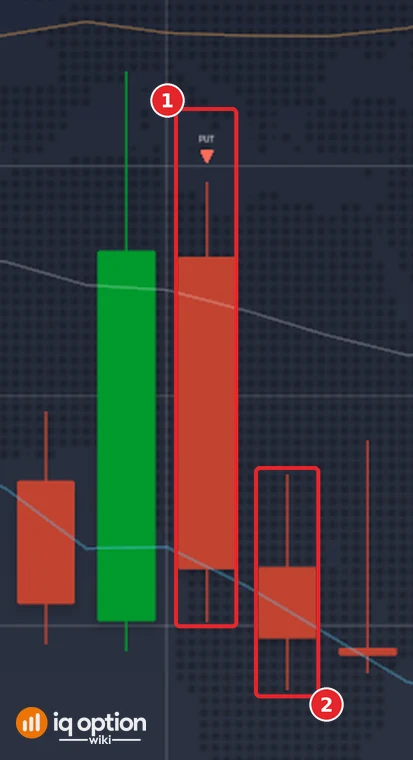
Signal Gun: PUT at 22:05
The candle (1) that opened at 22:00 and closed at 22:05 at 1.13365 had a bearish score of 17 (MACD 7, because the histogram was 0.07 of ATR, and the candle patterns 10) against a bullish 3 (the close sat near the lower band, %B 0.03). Two families agreed on the bearish side, so the direction was PUT. The confluence was 67: 64 from agreement, strength and coverage, and 3 for the low ATR-to-price ratio (0.02%). That passes 65; a strategy boost of 10 made the displayed strength 77, under the 80 of GUN+, so the marker is a plain PUT. A Lower trade opened at that close ended at 22:10, when the next candle (2) closed at 1.13359, 0.6 pip lower: it won.
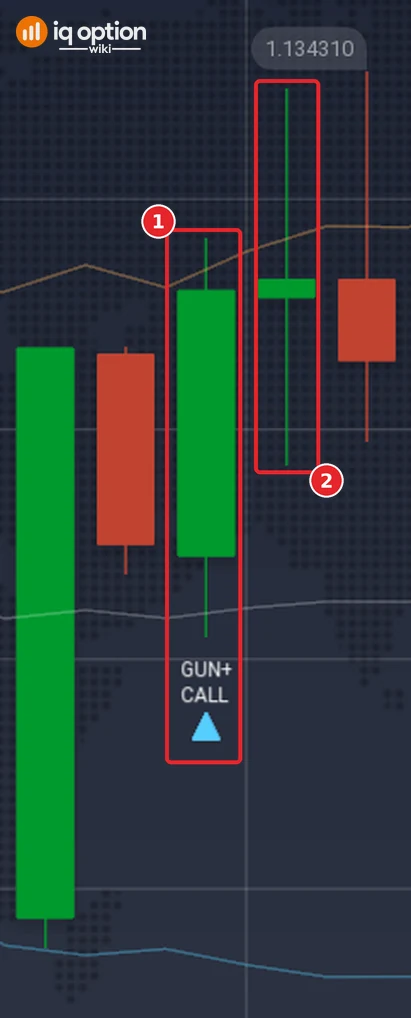
Signal Gun: GUN+ CALL at 22:30
The candle (1) that opened at 22:25 and closed at 22:30 at 1.13412 had a bullish score of 19 (MACD 9, because the histogram was 0.150 of ATR, just over the 0.15 that counts as strong, and the candle patterns 10) against a bearish 3 (the close near the upper band). The confluence was 70, with a strategy boost of 10 for a positive histogram, an RSI of 57 and a close over the middle line. 70 + 10 reaches the displayed strength of 80, so the marker is the large GUN+ CALL. A Higher trade opened at that close ended at 22:35, when the next candle (2) closed at 1.13413, 0.1 pip higher: it won by a tenth of a pip.
The two scripts, tested
We ran the source of each script on 1,334 five-minute EUR/USD candles (29 September to 5 October 2026) and counted each marker as a trade that opens at the close of the marked candle: HIGHER and CALL as Higher, LOWER and PUT as Lower. The first 200 candles of every stretch are skipped, because the platform’s indicators had been running before our recording began.
Tested on IQ Option: the markers of IQ Wiki Signals V1.1.0, EUR/USD candles of 29 September to 5 October 2026
| Asset and candles | EUR/USD binary (regular, not OTC): 1,334 five-minute candles (2026-09-29 01:55 to 2026-10-02 20:55 UTC and 2026-10-04 21:00 to 2026-10-05 17:00 UTC). The candles were recorded from IQ Option’s Practice traderoom. The replay places no orders; it only scores the rule on those closed candles, at an 85% payout. |
|---|---|
| Rule tested | The markers of the two scripts with their default inputs, read from a replay of the library sources on the candles: a HIGHER or CALL marker is a Higher trade and a LOWER or PUT marker a Lower trade, opened at the close of the marked candle (the moment the marker becomes available) and lasting 5 minutes on 5-minute candles. The first 200 candles of each stretch are skipped. The box lists Regular Signals first, then the Signal Gun, the GUN+ markers alone, and the 15-minute trades. |
| Signals | Regular Signals HIGHER and LOWER, 5-minute candles, 5-minute trade: 109 signals (57 Higher, 52 Lower) Binary Signal Gun CALL and PUT (including GUN+), 5-minute candles, 5-minute trade: 148 signals (86 Higher, 62 Lower) Binary Signal Gun GUN+ markers only, 5-minute candles, 5-minute trade: 74 signals (38 Higher, 36 Lower) Regular Signals, 5-minute candles, 15-minute trade: 109 signals (57 Higher, 52 Lower) Binary Signal Gun, 5-minute candles, 15-minute trade: 148 signals (86 Higher, 62 Lower) |
| Outcomes | Regular Signals HIGHER and LOWER, 5-minute candles, 5-minute trade: 50 won, 58 lost, 1 tied; 46.3% of the 108 decided trades won; net −$0.14 per $1 staked at 85% (−$0.12 at 91%) Binary Signal Gun CALL and PUT (including GUN+), 5-minute candles, 5-minute trade: 69 won, 78 lost, 1 tied; 46.9% of the 147 decided trades won; net −$0.13 per $1 staked at 85% (−$0.10 at 91%) Binary Signal Gun GUN+ markers only, 5-minute candles, 5-minute trade: 35 won, 39 lost, 0 tied; 47.3% of the 74 decided trades won; net −$0.12 per $1 staked at 85% (−$0.10 at 91%) Regular Signals, 5-minute candles, 15-minute trade: 59 won, 50 lost, 0 tied; 54.1% of the 109 decided trades won; net +$0.00 per $1 staked at 85% (+$0.03 at 91%) Binary Signal Gun, 5-minute candles, 15-minute trade: 70 won, 78 lost, 0 tied; 47.3% of the 148 decided trades won; net −$0.12 per $1 staked at 85% (−$0.10 at 91%) |
| Break-even | At an 85% payout a trade needs to win more than 54.1% of its decided trades to break even (1 ÷ 1.85); at 91%, more than 52.4% (1 ÷ 1.91). |
A replay is only a look back at candles recorded on the dates above: it placed no real orders, covers about four and a half days of one pair, and counts overlapping trades as if they were independent. A short test proves nothing about the future, and no profit and no win rate is promised here. IQ Option’s own blog on backtesting says that most strategies need dozens, and often hundreds, of trades before a result means anything.
The 5-minute trades won 46.3% of the decided trades for Regular Signals (50 of 108, one tie) and 46.9% for the Signal Gun (69 of 147, one tie); the large GUN+ markers alone won 47.3% (35 of 74). All three are below the break-even rate of 54.1% at an 85% payout, and their 95% intervals (37% to 56%, 39% to 55% and 36% to 59%) include it. Held for 15 minutes instead of 5, Regular Signals won 54.1% (59 of 109, interval 45% to 63%) and the Signal Gun 47.3%. A few days of one pair cannot tell a real edge from luck, and no result here is a promise.
The replay is the code of the two files, not a re-implementation. To check it we compared it with the platform: in the four windows of this guide Regular Signals drew 11 markers and the Signal Gun 9, and the replay puts every one of them on the same candle, with none missing and none extra.
Why can the chart script differ from the Signals website?
| Local V1.1.0 script | Signals website service |
|---|---|
| Uses the IQ Option asset that is open. | Scans separate Binance or Twelve Data symbols. |
| Uses the IQ Option chart’s completed candle. | Can read the provider’s newest candle during a timed scan. |
| Calculates over the loaded chart history. | Starts its indicators from a fixed recent window of candles. |
| Draws chart markers and can set an advice state. | Can store records, rotate assets, send Telegram messages and check outcomes. |
| Needs no network call or Cloudflare setup. | Depends on server providers, caches, a scheduler and a database. |
Using IQ Option data in the script is the closer match to the chart you are watching. It need not reproduce a card of the Signals website, because the feeds, the candle boundaries, the indicator start and the safety corrections differ on purpose.
Verification, sources and limits
The two files were parsed as Lua 5.3, checked against a component and confluence test suite, compared with the audited local Signals source and pinned by SHA-256 in the public download registry. On 8 October 2026 we also imported both into the IQ Option web traderoom on a Practice account: both compiled, drew their lines and markers, and showed the settings dialogs pictured here. A Lua parser cannot emulate every platform function, and the platform can change, so run them on a Practice chart before you rely on them.
- Quadcode Script Basics: the Lua basis and custom indicators.
- Quadcode Script Options: the import and export workflow.
- Quadcode conditional: the stored setup history.
- IQ Option Scripts Library: exact source previews, hashes and downloads.
- How to import scripts in IQ Option: the full illustrated install and delete workflow.
- IQ_WIKI_SCRIP_V1.0.1 guide: the five-filter trend script, which V1.1.0 does not change.
Both V1.1.0 scripts are released under the MIT License and provided “as is”, without warranty. IQOptionWiki is independent of the IQ Option platform operator. Nothing in this guide is investment advice, a personal recommendation, a probability claim or a promise of results.
Common mistakes
- Adding both scripts at once and then reading the markers. Their Bollinger lines overlap; add one, learn it, then try the other.
- Reading 65 or 80 as a win rate. They are rule thresholds of the Signal Gun, not probabilities; our replay won under 50%.
- Entering at the marked candle. The marker exists only once the next candle has begun; the earliest entry is the close of the marked candle.
- Enabling advice in both scripts. Their states cannot coordinate; switch it on in one script at a time, and do not expect an order from it.
- Changing several inputs at once. Keep the notes of asset, timeframe, settings and the time the next candle began, and change one input at a time.
Related guides
- IQ_WIKI_SCRIP_V1.0.1: five filters and LONG and SHORT markers
- How to import scripts in IQ Option and the IQ Option scripts library
- The RSI indicator, the MACD indicator and Bollinger Bands on IQ Option
- All indicator guides and all strategy guides
Frequently Asked Questions
Q: What is IQ Wiki Signals V1.1.0?
A: Two free scripts for the IQ Option chart: IQ_WIKI_SCRIP_V1.1.0 (Regular Signals), which scores RSI, MACD, Bollinger Bands and candle patterns, and IQ_WIKI_BINARY_SIGNAL_GUN_V1.1.0, which needs two or more indicator families to agree.
Q: How do I install them?
A: Download the .lua files, open Chart analysis, choose the Scripts tab, click Import script, choose a file and click the plus button under the editor. Add one script at a time.
Q: What do the markers mean?
A: HIGHER or CALL (a green triangle under a candle) means the bullish rules were met on that closed candle; LOWER or PUT (a red triangle over it) the bearish rules. GUN+ marks a Signal Gun signal that also met a strategy alignment and a strength of 80.
Q: Do the scripts place trades?
A: No. They draw markers and can set an advice state; they do not trade, choose an expiry or send messages.
Q: Why is there a marker on the previous candle?
A: The script confirms candle N only when candle N+1 begins and draws the marker back on candle N. The marker is not an earlier signal.
Q: What does Display and advice do?
A: It is Disabled by default. Enabled sets a buy, sell or neutral advice state of the script language from the same completed setup. We saw no change on the web chart or in the Widgets tab when we switched it on.
Q: Do they win?
A: In our replay on EUR/USD 5-minute candles, Regular Signals won 46.3% of its decided 5-minute trades and the Signal Gun 46.9%, below the 54.1% needed to break even at an 85% payout.
Q: Why do the scripts differ from the Signals website?
A: They read the IQ Option chart, wait for the candle to close, mark only a new setup and correct several behaviours of the web services, so the cards of the website need not match the markers.

