
Last updated: 8 October 2026. Every screenshot below was recorded on 8 October 2026 on an IQ Option Practice account registered in Brazil, on EUR/USD 5-minute candles; the Chart analysis picture in Step 1 was recorded on 5 October 2026. We placed no real-money trade. The script file is the one of the IQ Option Scripts Library, imported unchanged. The tested box shows how its markers did on EUR/USD candles recorded between 29 September and 5 October 2026; it says nothing about what will happen next.
IQ_WIKI_SCRIP_V1.0.1 is a free script for the IQ Option chart. It draws three exponential moving averages (9, 21 and 50), a ribbon between the first two, and a green LONG or a red SHORT marker on a candle when five filters agree on that closed candle: the trend of the averages, RSI, ADX with its two directional lines, ATR and the distance of the close from the fast average. You add it in Chart analysis, Scripts, Import script: choose the .lua file, then click the plus button. It places no orders and chooses no expiry. We replayed its source on 1,334 five-minute EUR/USD candles: it drew 71 markers once its warm-up was over, and 5-minute trades opened at the close of the marked candle won 34, lost 36 and tied once, 48.6% of the decided trades against the 54.1% needed to break even at an 85% payout.
Quick answer
- Script: IQ_WIKI_SCRIP_V1.0.1, a free .lua file (MIT licence) from the IQOptionWiki scripts library; it draws on the price chart of the timeframe you open.
- LONG: a green triangle under a candle when all five bullish filters agree on the closed candle. SHORT: a red triangle over a candle for the bearish mirror.
- Install: Chart analysis, Scripts tab, Import script, choose the file, then the plus button under the editor.
- Timing: the marker is drawn on the qualifying candle but only becomes available when the next candle begins; it repeats only after the setup has broken and formed again.
- Orders: none. The script does not trade, choose an expiry, or predict the next candle.
- Tested: 71 markers on 5-minute candles, 5-minute trades won 48.6% of the decided trades (34 of 70); break-even is 54.1% at an 85% payout, and the interval is 37% to 60%.
Download the exact .lua file
Reviewed plain-text source
The download serves the same hash-pinned source that the public library shows. You can open the file in any plain-text editor before you import it.
SHA-256: e2bdb8391ebe6ab801e38f04d5129209e3586d5a4aa70d73ecbcfbb6c66011ceHow do you install IQ_WIKI_SCRIP_V1.0.1 on IQ Option?
Set the chart
Choose the asset, the chart type and the candle size first: the script is calculated from the candles on the chart. The examples in this guide use 5-minute candles on EUR/USD. These steps use the web traderoom on a Practice balance, and the numbers in each screenshot match the numbers in the text. If you do not have an account yet, see how to register.
Step 1: Open Chart analysis
Click the indicators button (1), the wave icon in the chart toolbar at the bottom left of the chart. The Chart analysis panel opens with the tabs Indicators, Templates, Widgets and Scripts. The next step opens the Scripts tab.

Step 2: Open the Scripts tab
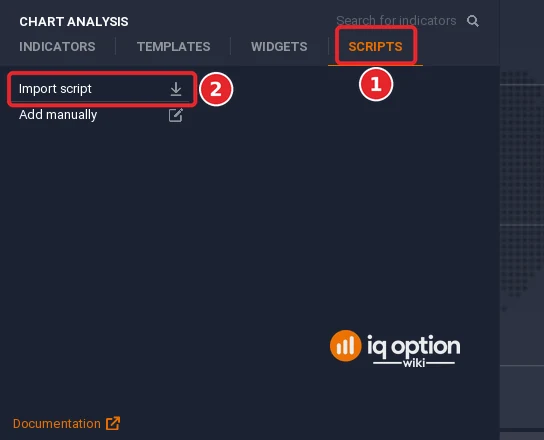
Click the Scripts tab (1) of the Chart analysis panel. It has two rows: Import script (2), which takes a file from your computer, and Add manually, which opens an empty editor. Click Import script and choose IQ_WIKI_SCRIP_V1.0.1.lua, the file you downloaded above, in the file window of your browser.
Step 3: Check the imported code
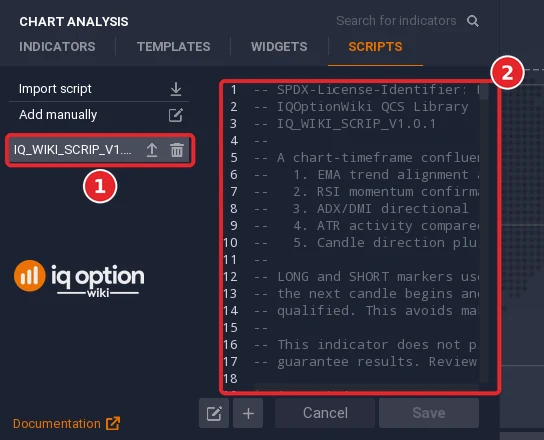
After the file is chosen, the script appears as a row in the list (1), named IQ_WIKI_SCRIP_V1.0.1, and its code opens in the editor on the right (2). The first lines are the licence and a plain-English description of the five filters. The platform did not report an error: the file compiled.
Step 4: Add it to the chart
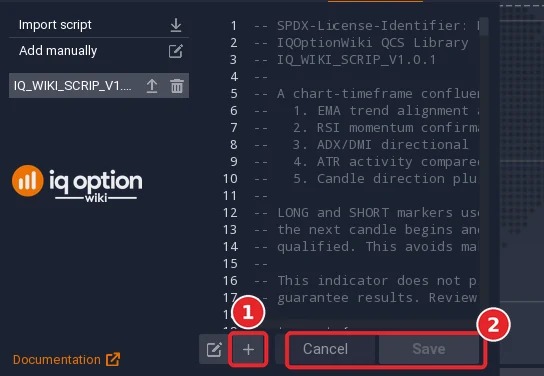
Click the plus button (1) under the editor. Cancel and Save (2) are grey because nothing was changed; Save only turns orange after you edit the code, and the imported script is already in the list. Click the chart or press Escape to close the panel and see the whole chart.
Step 5: Look at the chart
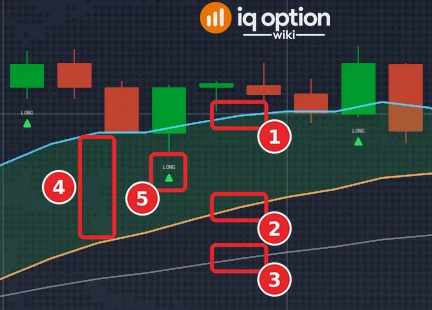
Four things are drawn over the candles: the cyan fast EMA (1), the orange slow EMA (2), the translucent grey anchor EMA (3), and a ribbon between the fast and the slow line (4) that is green when the fast line is above the slow one and red when it is below. A green LONG triangle under a candle, or a red SHORT triangle over one (5), appears only when all five filters agree. Most candles have no marker.
Step 6: Find it in the Added list
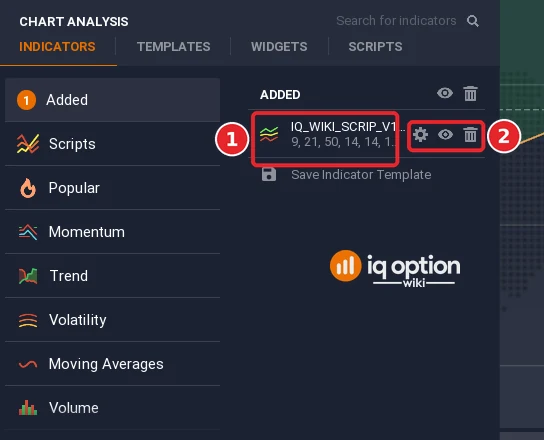
Open Chart analysis again and choose the Indicators tab, then Added. The entry IQ_WIKI_SCRIP_V1.0.1 (1) shows the values of its first inputs (9, 21, 50, 14 and so on). Three icons stand at its right (2): the gear opens its settings, and the bin takes it off the chart; the script itself stays in the Scripts list.
Step 7: Read the settings
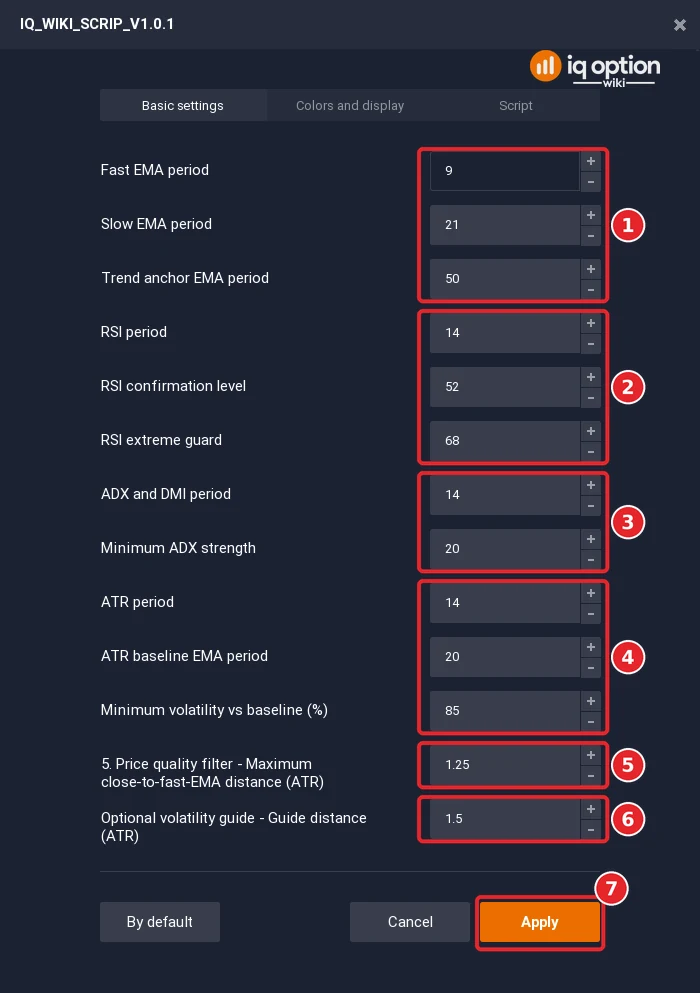
The gear opens a dialog with three tabs: Basic settings, Colors and display, and Script (the code, for reading). The Basic settings tab lists 13 numbers. They are the trend inputs (1), the RSI inputs (2), the ADX inputs (3), the ATR inputs (4), the price-quality input (5) and the distance of the optional volatility guide (6); Apply (7) redraws the chart. The list scrolls, and the picture joins its top and its end. Leave the defaults for your first run; the table below says what each number does.
Step 8: Check the colours and the display switches
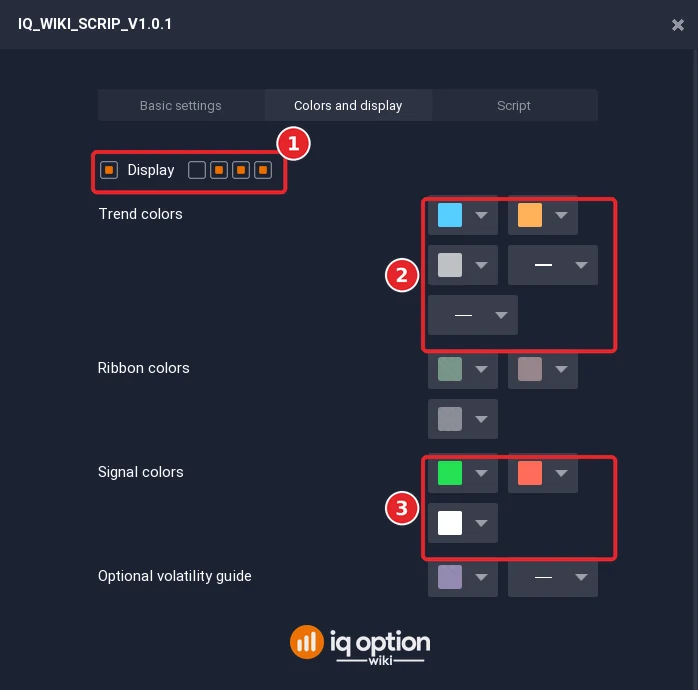
The Colors and display tab holds the Display switches (1), the colours of the lines and the ribbon, the trend colours (2) and the signal colours (3). They change what you see, not when a marker appears. One of the switches is off by default: the optional volatility guide, which the chart does not draw.
Step 9: Put it back later
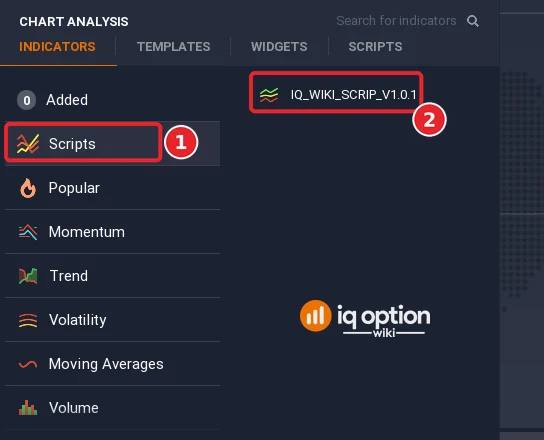
The imported script stays in the list after you take it off the chart. To use it again, open Chart analysis, Indicators, then Scripts (1) and click its name (2): the same dialog opens, and Apply puts it back on the chart. The bin in the Scripts tab deletes the script itself.
What is drawn on the chart?
The visible layer stays simple although several calculations run behind it. Everything below uses the script with its default inputs.
- Cyan line: the fast EMA, period 9.
- Orange line: the slow EMA, period 21.
- Translucent grey line: the trend-anchor EMA, period 50.
- Green or red ribbon: only the relation between the fast and the slow EMA. A coloured ribbon does not mean that all five filters passed.
- Green LONG triangle under a candle: a new bullish combined setup on a completed candle. Red SHORT triangle over a candle: a new bearish one.
RSI, ADX with its two directional lines, and the ATR baseline are calculated but not drawn. The large green and red sentiment symbols at the far left of the platform belong to IQ Option’s interface, not to this script.
How do the five filters decide?
A marker needs every row below to agree on the same completed candle. They are five different filters built from price data, not five independent forecasts.
| Filter | LONG requirement | SHORT requirement | In plain words |
|---|---|---|---|
| 1. Trend | EMA 9 above EMA 21 above EMA 50; EMA 21 and EMA 50 are rising. | EMA 9 below EMA 21 below EMA 50; EMA 21 and EMA 50 are falling. | The three averages are in order and the two slower ones slope the same way. |
| 2. Momentum | RSI 14 from 52 through 68. | RSI 14 from 32 through 48. | RSI leans with the setup without passing the extreme guard. |
| 3. Strength | ADX at least 20 and +DI above -DI. | ADX at least 20 and -DI above +DI. | ADX sets the strength floor; the two DI lines give the direction. |
| 4. Activity | ATR 14 at least 85% of its 20-period EMA. | The same rule. | Recent movement is not unusually quiet next to its own baseline. |
| 5. Price quality | A bullish candle that closes above EMA 9 by no more than 1.25 ATR. | A bearish candle that closes below EMA 9 by no more than 1.25 ATR. | The candle agrees with the direction and has not closed too far from the fast average. |
The script requires no minimum candle body, and the fast EMA has no slope rule of its own. The activity filter does not mean that volatility is high: at the default 85%, ATR may still be 15% below its recent baseline. If the three periods are not in the order fast, slow, anchor, the lines still draw but the markers are switched off on purpose.
When does a marker appear, and when can you act on it?
The script waits for a candle to finish. Take three candles in a row.
- Candle N-1: at least one of the five filters is not aligned, so there is no setup.
- Candle N: all five filters become true. Nothing is shown while this candle is still forming.
- Candle N+1 begins: the script sees that candle N completed a new setup and draws the marker back on candle N.
The marker therefore sits on candle N, but it only becomes available when candle N+1 begins. A trade can open no earlier than the close of candle N, which is that same moment; on a chart you scroll back through, the marker looks like an earlier signal than it was. The marker also marks a change from false to true: it does not repeat on every candle while the five conditions stay true, and another marker needs the setup to break and form again.
What do the settings do?
The defaults are a starting profile, not a claim that they suit every asset or timeframe. Change one input at a time. A period of 9 always means nine candles of whatever timeframe is open.
| Setting in the dialog | Default | What it controls |
|---|---|---|
| Fast EMA period, Slow EMA period, Trend anchor EMA period | 9, 21, 50 | The order and slope of the trend filter and the three lines. They must be in the order fast, slow, anchor, from the smallest period to the largest. |
| RSI period | 14 | The lookback of the momentum filter. |
| RSI confirmation level, RSI extreme guard | 52, 68 | The bullish band 52 to 68; the bearish band is its mirror, 32 to 48. |
| ADX and DMI period, Minimum ADX strength | 14, 20 | The strength calculation and the least ADX that counts. |
| ATR period, ATR baseline EMA period | 14, 20 | Current movement and its recent baseline. |
| Minimum volatility vs baseline (%) | 85 | Skips setups in unusually quiet conditions. |
| Price quality filter, maximum close-to-fast-EMA distance (ATR) | 1.25 | Stops a close that is too far from the fast average from qualifying. |
| Optional volatility guide, guide distance (ATR) | 1.5 | Only for the optional guide, which is off by default: the slow EMA plus and minus 1.5 ATR. It is not the 1.25 ATR limit of the price-quality filter, which is measured from the fast EMA. |
Two markers of the recording, step by step
The first LONG marker and the first SHORT marker of the replay after its warm-up, in time order, not picked by outcome. All times are the platform clock, which is UTC minus three hours.
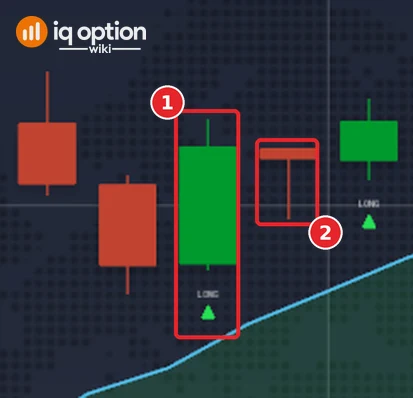
LONG marker on the candle that closed at 15:55, 29 September
The candle (1) that opened at 15:50 and closed at 15:55 at 1.13416 was bullish (it opened at 1.13384). EMA 9 was at 1.13367, above EMA 21 at 1.13314 and EMA 50 at 1.13311, and both slower averages were rising. RSI 14 read 65.6, inside 52 to 68. ADX was 37.7 with +DI at 31.7 over -DI at 16.6. ATR was 4.5 pips against a 20-period baseline of 4.1 pips, 109%, above the 85% floor, and the close stood 4.9 pips over EMA 9, 1.08 ATR, inside the 1.25 limit. By the script’s rule the marker became available when the 15:55 candle began. A Higher trade opened at that close ended at 16:00, when the candle (2) that opened at 15:55 closed at 1.13413, 0.3 pip lower: it lost.
SHORT marker on the candle that closed at 01:00, 30 September
The candle (1) that opened at 00:55 and closed at 01:00 at 1.133245 was bearish (it opened at 1.13336). EMA 9 was at 1.13351, below EMA 21 at 1.13367 and EMA 50 at 1.13378, and both slower averages were falling. RSI read 36.3, inside 32 to 48. ADX was 21.2, just over the floor of 20, with -DI at 24.3 over +DI at 13.3. ATR was 2.3 pips, level with its baseline, and the close stood 2.6 pips under EMA 9, 1.15 ATR, inside the 1.25 limit. A Lower trade opened at that close ended at 01:05, when the candle (2) that opened at 01:00 closed at 1.133285, 0.4 pip higher: it lost.
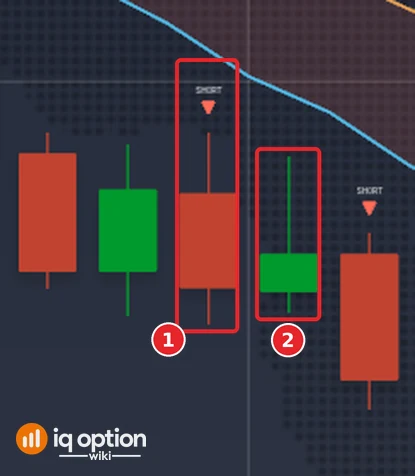
Both of these first trades lost by less than half a pip. That is only two trades; the next section counts all of them.
IQ_WIKI_SCRIP_V1.0.1, tested
We ran the script’s source on 1,334 five-minute candles (29 September to 5 October 2026) and on 1,505 one-minute candles, and counted each marker as a trade that opens at the close of the marked candle: LONG as Higher, SHORT as Lower. The first 200 candles of every stretch are skipped, because the platform’s averages had been running before our recording began.
Tested on IQ Option: the markers of IQ_WIKI_SCRIP_V1.0.1, EUR/USD candles of 29 September to 5 October 2026
| Asset and candles | EUR/USD binary (regular, not OTC): 1,334 five-minute candles (2026-09-29 01:55 to 2026-10-02 20:55 UTC and 2026-10-04 21:00 to 2026-10-05 17:00 UTC); 1,505 one-minute candles (2026-10-02 18:23 to 2026-10-02 20:59 UTC and 2026-10-04 21:01 to 2026-10-05 19:28 UTC). The candles were recorded from IQ Option’s Practice traderoom. The replay places no orders; it only scores the rule on those closed candles, at an 85% payout. |
|---|---|
| Rule tested | The markers of IQ_WIKI_SCRIP_V1.0.1 with its default inputs, read from a replay of the library source on the candles: a LONG marker is a Higher trade and a SHORT marker a Lower trade, opened at the close of the marked candle (the moment the marker becomes available) and lasting 5 minutes on 5-minute candles. The first 200 candles of each stretch are skipped. The box lists the main reading first, then the 15-minute trade and the 1-minute candles. |
| Signals | LONG and SHORT markers, 5-minute candles, 5-minute trade: 71 signals (37 Higher, 34 Lower) same, 5-minute candles, 15-minute trade: 71 signals (37 Higher, 34 Lower) same, 1-minute candles, 1-minute trade: 99 signals (50 Higher, 49 Lower) |
| Outcomes | LONG and SHORT markers, 5-minute candles, 5-minute trade: 34 won, 36 lost, 1 tied; 48.6% of the 70 decided trades won; net −$0.10 per $1 staked at 85% (−$0.07 at 91%) same, 5-minute candles, 15-minute trade: 36 won, 35 lost, 0 tied; 50.7% of the 71 decided trades won; net −$0.06 per $1 staked at 85% (−$0.03 at 91%) same, 1-minute candles, 1-minute trade: 54 won, 43 lost, 2 tied; 55.7% of the 97 decided trades won; net +$0.03 per $1 staked at 85% (+$0.06 at 91%) |
| Break-even | At an 85% payout a trade needs to win more than 54.1% of its decided trades to break even (1 ÷ 1.85); at 91%, more than 52.4% (1 ÷ 1.91). |
A replay is only a look back at candles recorded on the dates above: it placed no real orders, covers about four and a half days of one pair, and counts overlapping trades as if they were independent. A short test proves nothing about the future, and no profit and no win rate is promised here. IQ Option’s own blog on backtesting says that most strategies need dozens, and often hundreds, of trades before a result means anything.
On 5-minute candles the 5-minute trades won 48.6% of the 70 decided trades (34 of 70, one tie), and the 15-minute trades 50.7% (36 of 71). Both are below the break-even rate of 54.1% at an 85% payout, and their 95% intervals (37% to 60% and 39% to 62%) are wide. On 1-minute candles the trades won 55.7% (54 of 97), a little above break-even but with an interval from 46% to 65%. None of these numbers separates the script from a coin flip, and a few days of one pair prove nothing about other markets or periods.
The replay is the script’s own code, not a re-implementation of its rules. To check it we compared it with the platform: in the two windows of this guide the platform drew 8 markers (4 LONG and 1 SHORT in the first window, 3 SHORT in the second), and the replay puts all 8 on the same candles, with none missing and none extra.
Sources and limits
The Lua source was read against Quadcode’s documented script functions. On 8 October 2026 we imported this exact file into the IQ Option web traderoom on a Practice account and saw the three EMA lines, the ribbon, the LONG and SHORT markers, the Added-list entry and the settings dialog shown here. This does not establish a win rate or future compatibility with the platform.
- Quadcode Script Basics: Lua 5.3 basis, custom inputs and overlay display.
- Quadcode Script Options: import, manual entry, export and supported file formats.
- Your First Indicator: calculations, inputs, Save, Add to chart and settings.
- Quadcode conditional series function: the stored condition history behind the completed-candle transition.
- Quadcode plot shape reference: marker parameters, bar offset and the documented mobile shape substitutions.
- IQ Option Scripts Library: the exact source preview, download, licence and SHA-256 digest.
- How to import scripts in IQ Option: the full illustrated import, export and delete workflow.
Mobile shape note: the script asks for an upward triangle for LONG and a downward triangle for SHORT. Quadcode documents that certain mobile charts replace the downward triangle with an upward one, so both may point up on an affected chart. This changes the drawn shape, not the condition. Check the word, the colour and whether the marker sits above or below the candle, or use the desktop or web traderoom.
IQ_WIKI_SCRIP_V1.0.1 is released under the MIT License and provided “as is”, without warranty. IQOptionWiki is an independent educational website and is not the IQ Option platform operator. Nothing in this guide is investment advice, a personal recommendation, a prediction or a promise of results.
Common mistakes
- Reading the ribbon as a signal. It only shows EMA 9 against EMA 21; the five filters decide the markers.
- Treating the marker as an entry at the marked candle. It is drawn on candle N but only exists once candle N+1 has begun; the earliest entry is the close of candle N.
- Changing several inputs at once. Change one number, look at the markers, and go back to the defaults if you lose track.
- Counting the markers on a long history as proof. More or fewer historical markers does not show better performance; the replay above is a coin flip.
- Starting on a real balance. The script is an educational chart tool; run it on a Practice balance first.
Related guides
- IQ Wiki Signals V1.1.0: Regular Signals and Binary Signal Gun, the two scripts that score RSI, MACD, Bollinger Bands and candle patterns
- How to import scripts in IQ Option and the IQ Option scripts library
- The EMA indicator on IQ Option, the RSI indicator and the EMA and ADX strategy
- All indicator guides and all strategy guides
Frequently Asked Questions
Q: What is IQ_WIKI_SCRIP_V1.0.1?
A: A free script for the IQ Option chart that draws three EMAs and a ribbon and marks a candle with LONG or SHORT when five filters (trend, RSI, ADX, ATR and price distance) agree on the closed candle.
Q: How do I install it?
A: Download the .lua file, open Chart analysis, choose the Scripts tab, click Import script, choose the file, and click the plus button under the editor. It then shows in Indicators, Added.
Q: Does it place trades or give alerts?
A: No. It draws lines and markers only. It does not choose an expiry, size a position or send alerts.
Q: Why are there lines but no markers?
A: That is normal: a marker needs all five filters at once, and the chart needs enough history for the anchor EMA, ADX and ATR baseline to warm up. Also check that the periods are in the order fast, slow, anchor.
Q: The ribbon is green or red but there is no marker. Why?
A: The ribbon shows only EMA 9 against EMA 21. RSI, ADX, ATR activity, price quality and the false-to-true rule must also pass.
Q: Why is there no marker on every candle that meets the conditions?
A: A marker means a new combined setup. Once it is true it must become false and then true again before another marker appears.
Q: Why does a marker look one candle late?
A: The script confirms candle N only when candle N+1 begins and then draws the marker back on candle N. That is the completed-candle check, not a delay.
Q: Can I get it back after I take it off the chart?
A: Yes. The script stays in the Scripts list. Open Chart analysis, Indicators, Scripts, click its name and Apply.
Q: Does it win?
A: In our replay on EUR/USD 5-minute candles, 71 markers produced 34 wins, 36 losses and 1 tie for 5-minute trades, 48.6% of the decided trades, below the 54.1% needed to break even at an 85% payout.

