
Last updated: 8 October 2026. Every screenshot below was recorded on 8 October 2026 on an IQ Option Practice account registered in Brazil. We placed no real-money trade. The defaults and signals described here come from IQ Option’s own blog and from the published source code of the platform’s built-in indicators. The tested box replays the zero-line cross, the only signal here that our script library codes as a fixed rule, on EUR/USD 5-minute candles recorded between 29 September and 5 October 2026; it says nothing about what the rule will do next.
Woodies CCI is a built-in IQ Option indicator that puts two Commodity Channel Index lines, a histogram, a zero line and two support and resistance lines in one panel under the price chart. IQ Option’s blog names three ways to read it: a bounce off the zero line, a straight line through the histogram’s peaks and troughs that points at zero, and a horizontal line through two peaks or troughs near the +100 or -100 line. This guide shows how to add the indicator, what each part shows, how the signals work and what the zero-line cross did in a replay.
Quick answer
- What it is: a built-in indicator in the Momentum list, drawn in its own panel under the price chart.
- Defaults: CCI period 14 (red line), CCI Turbo period 6 (green line), support and resistance lines at +100 and -100.
- Histogram: bars on either side of the zero line; green after a run of bars above zero, red after a run below it (IQ Option’s blog gives six bars).
- Signals named by IQ Option’s blog: zero-line reject, reverse divergence and horizontal trend line break. All are worded with “may”; none comes with an entry candle or an expiry.
- Zero-line cross, replayed: 72 signals on EUR/USD 5-minute candles (29 September to 5 October 2026), 3-candle expiry: 41 won, 31 lost, 56.9% of decided trades against 54.1% needed to break even at an 85% payout. A short replay says nothing about the future.
- Stop loss: none on a binary option; a CFD trade has a stop loss and a take profit.
- Break-even: at an 85% payout a trade has to win about 54.1% of the time (1 ÷ 1.85). With 72 trades the win rate has a margin of error of about ±6 points (one standard error), so 56.9% cannot be told from break-even.
How to add the Woodies CCI indicator to the chart on IQ Option
These steps use the web traderoom on a Practice balance. The numbers in each screenshot match the numbers in the text. Open the chart of the asset you want to analyse first.
Step 1: Open Chart analysis
Click the indicators button (1), the wave icon in the toolbar at the bottom left of the chart. It opens the Chart analysis panel, which has the tabs Indicators, Templates, Widgets and Scripts.

Step 2: Find Woodies CCI in the Momentum list
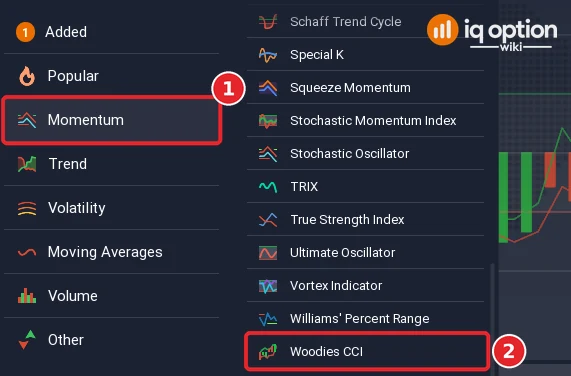
On the Indicators tab, click Momentum (1) and then Woodies CCI (2). IQ Option’s blog gives the same route. You can also type “Woodies” in the search box (“Search for indicators”) and click the result.
Step 3: Check the settings and apply
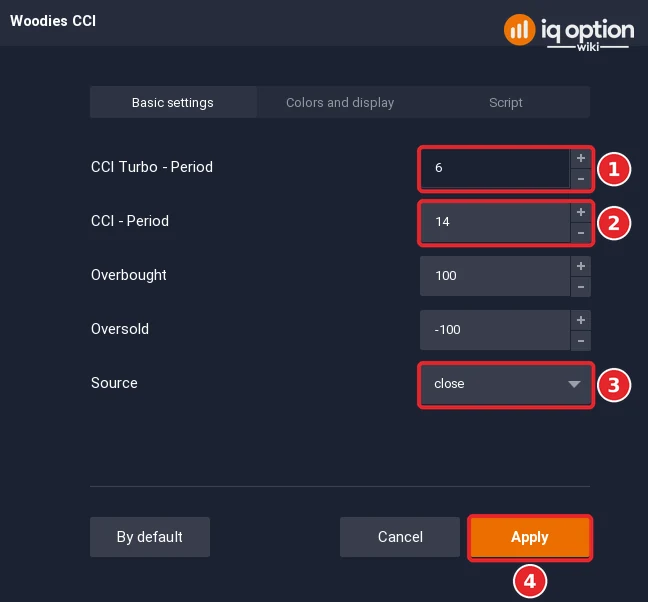
The indicator’s dialog opens on Basic settings, next to the Colors and display and Script tabs. The CCI Turbo period (1) is 6 by default and the CCI period (2) is 14; Overbought is 100 and Oversold is -100, and Source (3) is close. The colours are on the Colors and display tab. Leave the values as they are and click Apply (4). The By default button restores the standard values.
Step 4: Read the panel
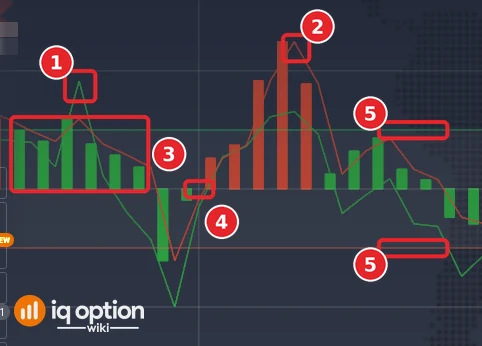
Woodies CCI opens in its own panel below the price chart, titled with its settings, WCCI (6,14,close). The green line (1) is the CCI Turbo, the red line (2) is the CCI, the bars (3) are the histogram, the line at zero (4) is the base line, and the lines at +100 and -100 (5) are the support and resistance lines.
What is Woodies CCI?
IQ Option’s blog calls Woodies CCI “an entire trading system in one indicator”, because it combines five elements: the CCI, the CCI Turbo, the CCI histogram, a base line and support and resistance lines. The same article reminds readers that no indicator gives 100% accurate indications.
The CCI is the Commodity Channel Index. It compares price with its own average over a set number of candles: when the line is above zero, price is above its recent average, and below zero it is below it. In the source code of the standalone CCI indicator, the value is the distance between the typical price (the average of the high, low and close) and its simple moving average, divided by 0.015 times the average deviation. The CCI has no fixed upper or lower limit. The CCI Turbo is, in the blog’s words, “just a regular CCI with a shorter period”, so it reacts faster than the 14-period line. In Woodies CCI both lines are calculated from the Source setting, which is the close by default, so the numbers differ slightly from the standalone CCI.
Defining the trend
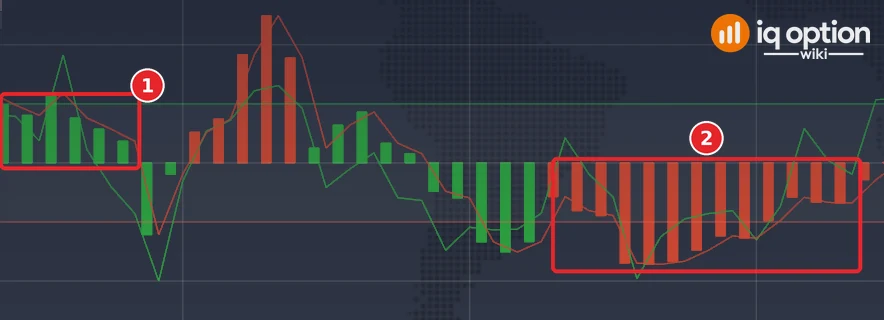
The histogram draws bars on either side of the zero line, from zero to the value of the 14-period CCI. IQ Option’s blog says that a histogram above the zero line means a positive trend and one below it a negative trend. The colour of a bar depends on the CCI’s recent history: after the CCI has stayed above the zero line for six bars or longer the next bar turns green, and after six bars or longer below it the next bar turns red. Read together, green bars above the zero line (1) show an uptrend and red bars below it (2) show a downtrend. A green bar below the line, or a red bar above it, appears when the CCI has just changed side and has not yet stayed on the new side for long enough.
How do you read a Woodies CCI indicator?
IQ Option’s blog lists three kinds of indication. Each one is worded with “may” or “might”, and the article gives no entry candle and no expiry for any of them. Two of the three rely on lines that you draw by hand on the histogram, so they are judgement calls, not fixed rules. Choose your entry candle and your expiry before you trade, and keep them the same from trade to trade.
Entry points with the Woodies CCI
The blog names the zero-line reject, the reverse divergence and the horizontal trend line break. They appear below as a histogram bounce, a trendline breakout and a support or resistance breakout.
A histogram bounce
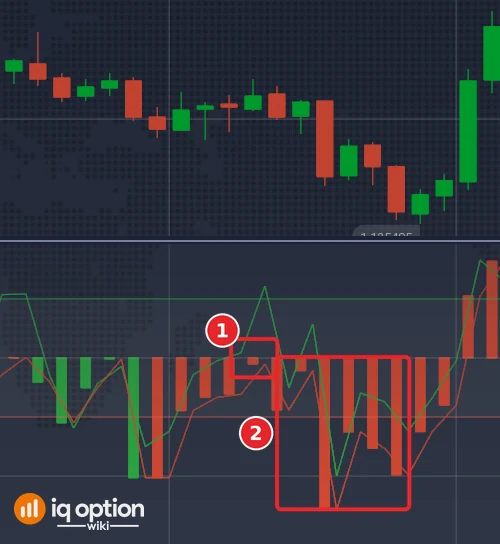
The zero line separates a negative trend from a positive one. When the CCI line (and with it the histogram) gets close to the zero line during a strong trend and then bounces off instead of crossing it, IQ Option’s blog calls it a zero-line reject. The blog says it may point to an entry in the direction of the prevailing trend: a Higher idea when the bars were above zero, a Lower idea when they were below it.
This example only shows what a zero-line reject looks like; it is not a signal of our test. On the 5-minute EUR/USD chart, in the candle that opened at 05:15 UTC on Tuesday 29 September 2026 (02:15 on the platform clock), the market had been falling and the histogram was red below zero. The CCI(14) rose to -10.6, just under the zero line, and turned back down (1), while the CCI Turbo spiked above +100. The bars then went below zero again and further (2). That candle closed at 1.13611; the candle that opened at 05:45 UTC closed at 1.13554. The bounce can only be called a reject in hindsight, and a single example says nothing about how often it works.
A trendline breakout
A trendline breakout is the break of a straight line drawn through the peaks or through the troughs of the histogram. IQ Option’s blog describes the line but not the break. When the peaks and troughs of the histogram can all be connected by one straight line and the line points at zero, it calls the pattern a reverse divergence and says that a strong trend in the direction of the line might be expected. Where to enter, and on which candle, is left open, so treat it as a judgement call. We did not test it.
The support or resistance breakout
The lines at +100 and -100 are the panel’s support and resistance lines. The blog’s horizontal trend line break uses them: when two CCI peaks or troughs sit at the same level close to a support or resistance line, it might point to an upcoming entry opportunity. In practice you draw a horizontal line through the two peaks (or troughs) and watch for the CCI to break through it. The blog does not give the entry candle, and we did not test this pattern. See also our guide to support and resistance.
Divergence
Divergence means price and the indicator move in opposite directions. IQ Option’s CCI guide says that on the CCI, divergence may point to a weakening trend. A bullish divergence is a lower low in price with a higher low on the CCI; a bearish divergence is a higher high in price with a lower high on the CCI. IQ Option’s guides to the RSI and the Stochastic Oscillator both treat divergence as a warning that still needs a trigger from price, and the same caution applies here: a divergence does not say which candle will reverse, and some divergences fail. Our guide to divergences covers the pattern, and the CCI divergence strategy applies it to this indicator.
Zero-Line Cross
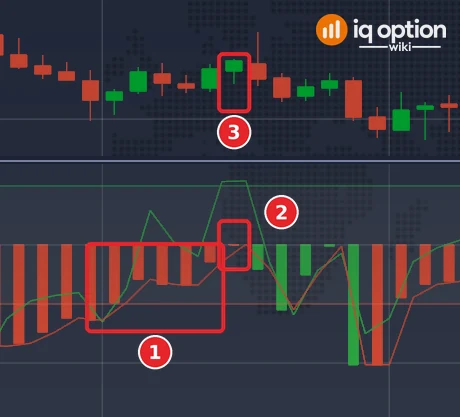
The simplest reading uses the zero line as the border between positive and negative: the CCI line moving from below zero to above it is a bullish change of side, and from above to below it is a bearish one. The line swings around zero whenever price moves sideways, so crosses are frequent there and can fail. Our script library therefore asks for more. In IQOW Woodies CCI a Higher marker needs the CCI(14) to have been below zero on each of the previous six candles, to close above zero, and the CCI Turbo(6) to be above zero on that candle too. A Lower marker is the mirror case. The six candles echo the run of six bars after which, according to IQ Option’s blog, the histogram changes colour. The library lists 5-minute to 15-minute candles for it.
The first Higher marker of this rule in our recorded data is the 5-minute EUR/USD candle that opened at 04:25 UTC on Tuesday 29 September 2026 (01:25 on the platform clock). The CCI(14) had been below zero on each of the six candles before it (1), it closed at +1.0, just above zero (2), and the CCI Turbo was at +108.2. The candle closed at 1.13629 (3). Three candles later, at 04:45 UTC, the price was 1.13616, so a Higher order opened at that close would have lost. The next Higher marker, the candle that opened at 06:00 UTC, closed at 1.13619 and would have won (1.136235 at 06:20 UTC). These are the first two Higher markers in time order, not picked by result. The picture shows the built-in Woodies CCI panel, which draws the same lines as the script; the script’s own marker is not shown.
Tested on IQ Option: 8 October 2026
| Asset and candles | EUR/USD (binary, regular market), 5-minute candles recorded from IQ Option’s Practice traderoom: 1,334 candles in two unbroken runs, Tuesday 29 September 2026 01:55 to Friday 2 October 21:00 UTC (1,093 candles) and Sunday 4 October 21:00 to Monday 5 October 17:05 UTC (241). The replay uses recorded candles and placed no real orders. |
|---|---|
| Rule tested | On 5-minute candles, with both CCI lines on the close (the Source default in the dialog): Higher when the CCI(14) was below zero on each of the previous six candles, closes above zero, and the CCI Turbo(6) is also above zero on that candle; Lower for the mirror case. Expiry 3 candles (15 minutes) after the signal candle closes. This is the rule of the library script IQOW Woodies CCI. The patterns that need hand-drawn lines are not tested. |
| Signals | 72 (39 Higher, 33 Lower). The plain zero-line cross, without the six-candle run and without the Turbo check, gave 162 signals (81 Higher, 81 Lower). |
| Outcomes | 41 won, 31 lost, none refunded: 56.9% of decided trades (Higher 24 of 39, Lower 17 of 33), a net gain of $3.85 on $72 staked at an 85% payout. Break-even is 54.1%; a gap of 2.8 points on 72 trades is too small to tell from chance. The plain cross: 90 won, 72 lost, 55.6%, a net gain of $4.50 on $162 staked. The library script IQOW Woodies CCI gave the same 72 signals on the same candles. With the CCI lines on the typical price instead of the close: 70 signals, 40 won, 30 lost. |
| Break-even | At an 85% payout a trade needs to win more than 54% of decided trades (1 ÷ 1.85); at 87%, 53.5%. |
A short replay proves nothing about the future. It used candles recorded from IQ Option’s Practice traderoom and placed no real orders. It shows what one fixed rule did on the candles that were replayed; another asset, another period or another candle size can give a different result. Nothing here is a promise of profit or of any win rate.
Pros and Cons
| Pros | Cons |
|---|---|
| Several elements in one panel: two CCI lines, a histogram, a zero line and two levels, so side and momentum can be read together. | Two of the three patterns IQ Option’s blog describes depend on lines you draw by hand, so two traders can read the same chart differently. |
| It is a built-in indicator in the Momentum list, and its periods, levels and colours can be changed. | IQ Option’s blog says the system may seem complex at the start and needs time and practice. |
| The zero-line cross can be written as a fixed rule, which can be tested on candles. | In a sideways market the CCI crosses zero often, so a zero-line cross can fail. |
| It can be tried on a Practice balance, which uses virtual money. | The sources give no entry candle and no expiry, so you have to choose them and test them yourself. |
Woodies CCI Indicator Components
| Component | What it shows | Default |
|---|---|---|
| CCI (red line) | How far price is from its recent average. Above zero, price is above its average; below zero, it is below it. | Period 14 |
| CCI Turbo (green line) | The same measure over a shorter period, so it reacts faster. | Period 6 |
| Histogram | Bars on either side of the zero line; green after a run of bars above zero, red after a run below it. | Green and red |
| Base line | The zero line, the neutral point between positive and negative readings. | 0 |
| Support and resistance lines | The levels the blog describes as oversold and overbought. | +100 and -100 |
IQ Option’s blog says the colours, the periods and the values of the support and resistance levels can all be adjusted, and that some traders keep the defaults while others change them to suit their goals.
Common mistakes
- Treating +100 and -100 as automatic reversal lines. The CCI has no fixed limits. IQ Option’s CCI guide shows an asset whose price tended to reverse near 200 in the past and suggests studying each asset’s own history, while reminding readers that past performance is not an indicator of future performance.
- Trading every zero-line cross. In a sideways market the line crosses zero often. The library script waits for six candles on one side first.
- Judging a drawn pattern in hindsight. A line that fits a finished chart may not have been visible when the entry candle closed.
- Leaving the entry candle and the expiry open. The sources give neither, so fix both before you trade.
- Expecting a stop loss on a binary option. A binary option has no stop loss and no take profit; you choose the direction, the stake and the expiry. A CFD (margin) trade has both.
Related guides
- CCI divergence strategy at IQ Option
- EMA and the CCI strategy, which uses the standalone CCI with a 50-period EMA
- CCI, RSI and Williams %R: the three-oscillator setup
- Divergences on IQ Option
- Support and resistance at IQ Option
- Identify breakouts at IQ Option
- IQ Option scripts library, with the IQOW Woodies CCI script that marks the zero-line cross on your chart
- All indicator guides and all strategy guides
Frequently Asked Questions
Q: What are the entry points with the Woodies CCI indicator?
A: IQ Option’s blog names three: the zero-line reject, the reverse divergence and the horizontal trend line break. Our script library codes a fourth reading, the zero-line cross, as a fixed rule.
Q: How do you identify the trend using the Woodies CCI histogram?
A: By the side of the zero line and the colour of the bars. Green bars above the zero line, after a run of bars above it, show an uptrend; red bars below the zero line, after a run below it, show a downtrend.
Q: Should you trade against the trend using the Woodies CCI indicator?
A: IQ Option’s blog describes the zero-line reject as an entry in the direction of the prevailing trend. It gives no rule for trading against the trend, and we did not test any.
Q: Can the Woodies CCI indicator be used in different markets?
A: IQ Option’s CCI guide says the CCI is now applied to most assets, including forex, stocks and crypto. We have not compared Woodies CCI across markets; the replay above covers EUR/USD only.
Q: What are the default settings of Woodies CCI on IQ Option?
A: According to IQ Option’s blog, the CCI period is 14, the CCI Turbo period is 6 and the support and resistance lines are at +100 and -100. The dialog also shows Source, set to close.
Q: Can I set a stop loss with Woodies CCI?
A: On a CFD (margin) trade you can set a stop loss and a take profit. A binary option has neither; the choices are the direction, the stake and the expiry.
Q: Where do I find Woodies CCI on IQ Option?
A: Click the indicators button at the bottom left of the chart, open the Indicators tab and choose Woodies CCI in the Momentum list, or search for “Woodies”.
Q: Can I add the zero-line cross as a script?
A: Yes. The IQ Option scripts library has IQOW Woodies CCI, which marks the cross described above. Import it as shown in our scripts guide. It marks only this cross; it does not draw trend lines or find divergences.

