
Last updated: 8 October 2026. Every screenshot below was recorded on 8 October 2026 on an IQ Option Practice account registered in Brazil, on 5-minute candles. We placed no real-money trade. The tested box replays the two-of-three rule on EUR/USD candles recorded from 29 September to 5 October 2026; it says nothing about what the rule will do next.
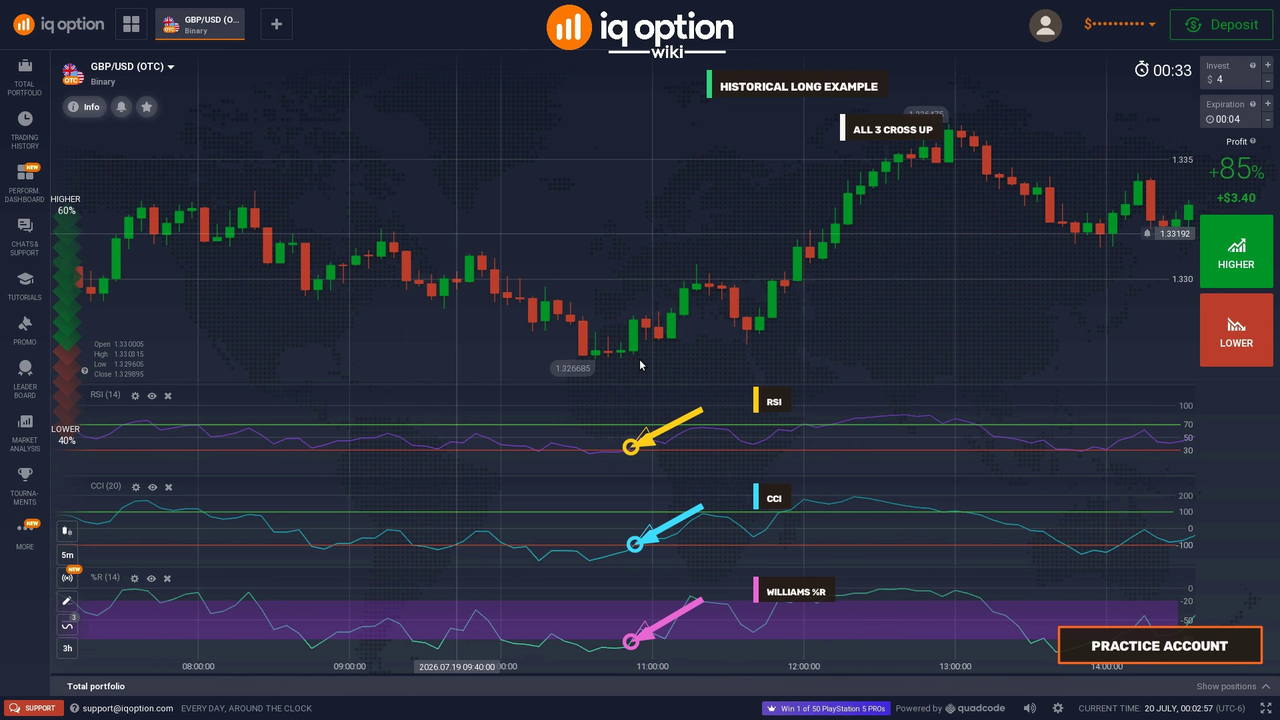
The “CCI RSI strategy” watches three oscillators at once: the RSI, the CCI and Williams %R. When at least two of them cross back out of their lower zone (RSI above 30, CCI above -100, Williams %R above -80) the setup is Higher, and when at least two cross back out of their upper zone (RSI below 70, CCI below +100, Williams %R below -20) it is Lower. This guide shows how to add the three indicators on IQ Option, how to read the crossings and what the rule did in a replay.
Video tutorial
Quick answer
- Indicators: RSI (period 14, levels 30 and 70), CCI (period 20, levels -100 and +100) and Williams %R (period 14, levels -80 and -20), each in its own panel.
- Higher: at least two of the three cross upward out of their lower zone: RSI above 30, CCI above -100, Williams %R above -80.
- Lower: the mirror: RSI below 70, CCI below +100, Williams %R below -20.
- Candles and expiry: 5-minute candles and an expiry equal to the candle length.
- Limit: all three are oscillators, so they often move together and their agreement adds less than three different tools would.
- Replay: on EUR/USD 5-minute candles from 29 September to 5 October 2026 the two-of-three rule gave 114 signals: 54 won, 59 lost, 1 refunded (47.8% of decided trades), against a break-even rate of 54.1% at an 85% payout. It says nothing about the future. With 113 trades the win rate has a margin of error of about ±5 points (one standard error), so 47.8% cannot be told from break-even.
Setting up the chart for CCI RSI strategy
These steps use the web traderoom on a Practice balance. The numbers in each screenshot match the numbers in the text. Choose the asset first (see choosing a trading asset), then add the three indicators one after another. Each one opens in its own panel under the price chart.
Step 1: Open Chart analysis
Click the indicators button (1), the wave icon in the toolbar at the bottom left of the chart. It opens the Chart analysis panel, which has the tabs Indicators, Templates, Widgets and Scripts and a search box (“Search for indicators”).

Step 2: Add the RSI
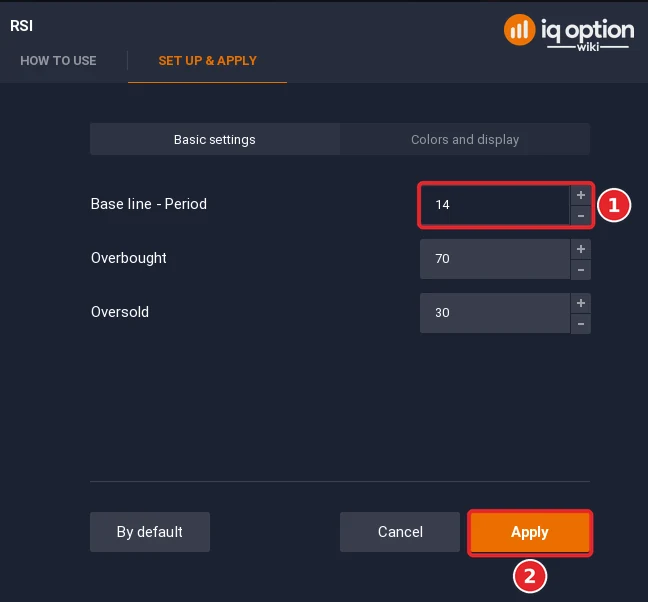
On the Indicators tab, type “RSI” in the search box and click Relative Strength Index (RSI). On Set up & apply, the Base line – Period (1) is 14 by default, with the overbought and oversold lines at 70 and 30. IQ Option’s RSI guide calls 14, 70 and 30 the standard approach and says you can click Apply (2) if you prefer the standard settings.
Step 3: Add the CCI and set the period to 20
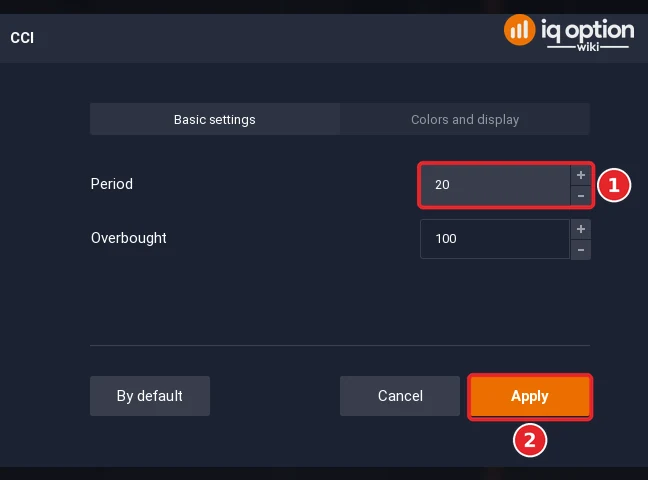
Search for “Commodity” and click Commodity Channel Index. On Basic settings, set Period to 20 (1) and click Apply (2). The dialog also has an Overbought field, 100 by default; the panel draws lines at +100 and -100.
Step 4: Add Williams %R
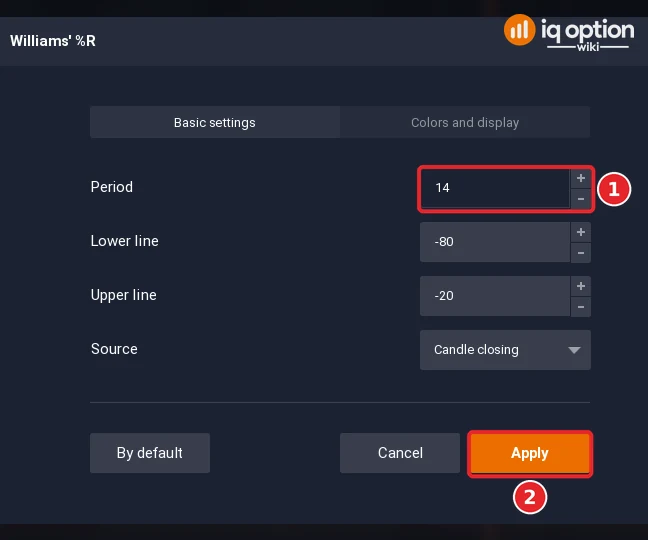
Search for “Williams” and click Williams’ Percent Range. The dialog is called Williams’ %R and the panel is labelled %R (14). The platform’s default period of 14 is used here, with the lower line at -80 and the upper line at -20 (Source: Candle closing). On Basic settings, check the Period (1) and click Apply (2).
Step 5: Use 5-minute candles
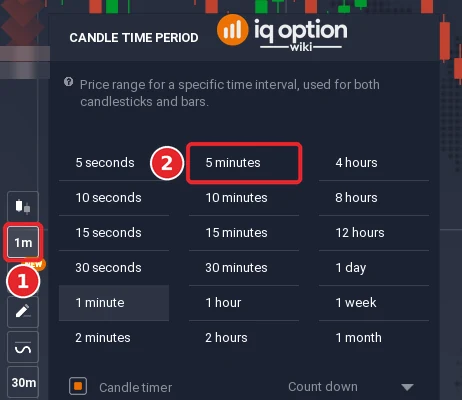
The replay below uses 5-minute candles. Click the candle time period button in the toolbar at the bottom left (1) and choose 5 minutes (2). Use a candlestick chart; see chart types and Japanese candlesticks if your chart shows another type.
Step 6: Check the three panels
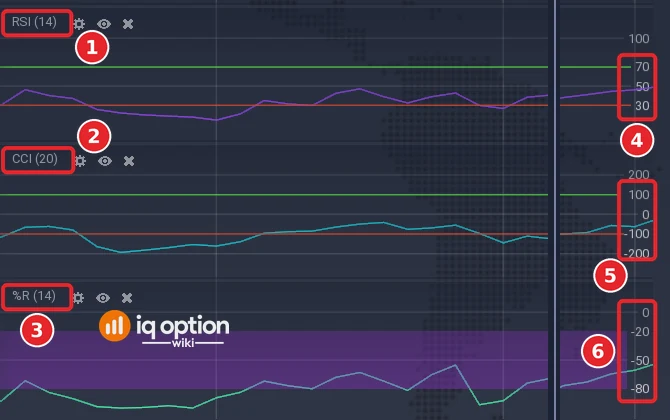
The RSI (1), the CCI (2) and Williams %R (3) sit one under the other below the price chart. The lines at 70 and 30 (4) belong to the RSI, the lines at +100 and -100 (5) to the CCI, and the lines at -20 and -80 (6) to Williams %R.
Step 7: Save the three indicators as a template
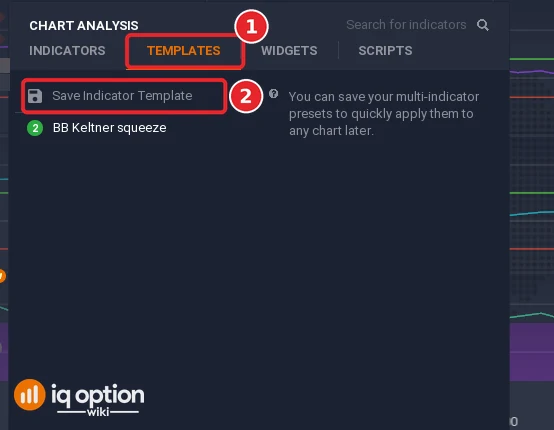
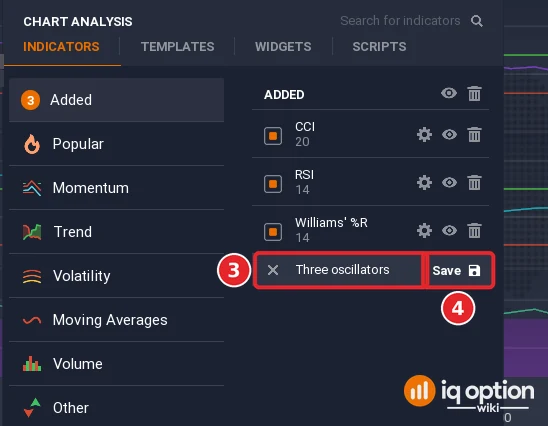
You do not have to repeat these steps on every chart. Open the Templates tab of Chart analysis (1) and click Save Indicator Template (2). A row appears under the added indicators: type a name in it (3) and click Save (4). We typed a name to take the screenshot and did not save it. Once you have saved a template, apply it from the same tab. Our guide to chart templates has more.
How to use the CCI RSI strategy of three on the IQ Option platform
The RSI, the CCI and Williams %R each measure something different, and each has a lower and an upper zone:
| Indicator | What it measures | Period | Lower level | Upper level |
|---|---|---|---|---|
| RSI | The balance between recent average gains and losses, on a scale from 0 to 100. | 14 | 30 | 70 |
| CCI | How far price is from its recent average, with no fixed limits. | 20 | -100 | +100 |
| Williams %R | Where the close sits between the lowest low and the highest high of the period, from -100 (at the low) to 0 (at the high). | 14 | -80 | -20 |
The strategy waits for a crossing back out of a zone. IQ Option’s RSI guide says that the RSI levels describe what price has been doing and do not predict the next candle, and that in a strong trend the RSI can stay in a zone for a long time. The CCI has no fixed limits, so it can also run far past its levels.
Opening long transactions with the CCI RSI strategy
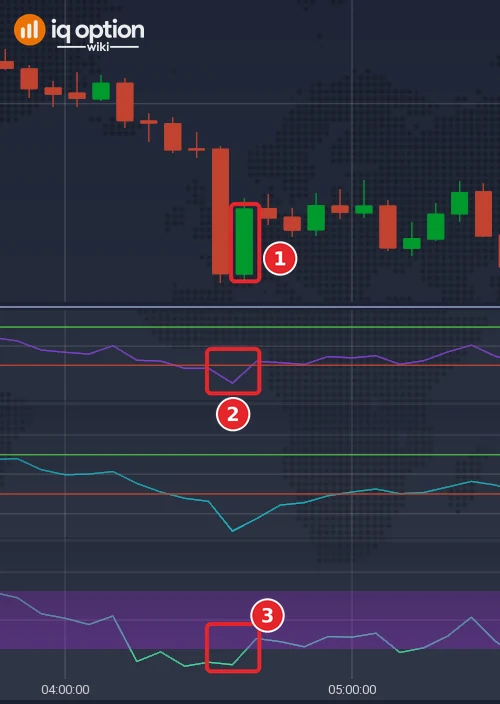
A long position is a Higher option on a binary option and a buy on a CFD. Look for these three crossings; the example below shows two of them on the chart.
- The RSI line crosses 30 from below: it moves from under 30 to above it.
- Williams %R crosses -80 from below and continues upward.
- The CCI line crosses -100 from below.
The rule needs at least two of the three crossings; a stricter variant needs all three, and the tested box shows both. The replay reads “crossing” like this: a crossing counts if it happens on the signal candle or on one of the two candles before it, and the signal is the first closed candle on which at least two have happened. This is also how our script library reads it. Open Higher at the close of that candle. The expiry equals the candle length, which is 5 minutes on 5-minute candles.
This is the first Higher signal of the replay: the 5-minute EUR/USD candle that opened at 07:35 UTC on Tuesday 29 September 2026 (04:35 on the platform clock) (1). The RSI went from 11.5 on the candle before to 34.2, back above 30 (2), and Williams %R went from -96.5 to -69.2, back above -80 (3). That is two of the three. The CCI had not crossed: it was still at -226.3, below -100. The candle closed at 1.134975; five minutes later the price was 1.13489, so a Higher order lost.
Opening short transactions with the CCI RSI strategy
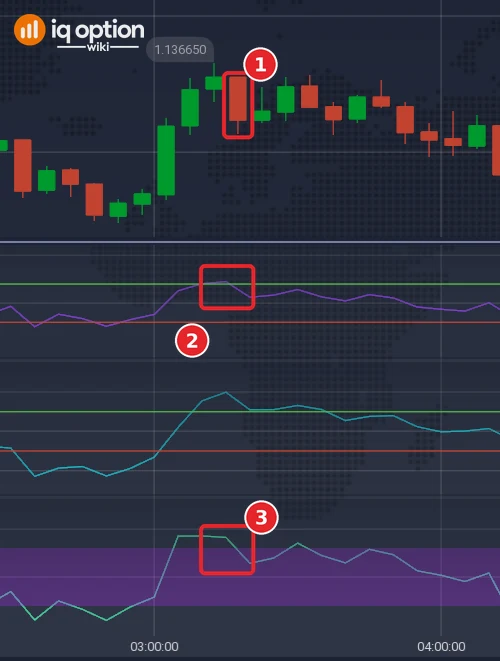
A short position is a Lower option on a binary option and a sell on a CFD. The crossings are the mirror image, from the upper zone downward:
- The RSI crosses 70 from above.
- Williams %R cuts -20 from above.
- The CCI crosses +100 from above and continues downward.
The same two-of-three reading, the same three-candle window and the same expiry apply: open Lower at the close of the first candle on which at least two of the crossings have happened.
This is the first Lower signal of the replay: the candle that opened at 06:15 UTC on the same day (03:15 on the platform clock) (1). The RSI went from 72.5 to 56.2, back below 70 (2), and Williams %R went from -8.6 to -35.6, back below -20 (3). The CCI had not crossed: at 109.4 it was still above +100. The candle closed at 1.136235; five minutes later the price was 1.1363, so a Lower order lost too. These are the first two signals in time order, not picked by result; over the whole replay 54 trades won, 59 lost and one was refunded, as the tested box shows.
Tested on IQ Option: EUR/USD candles of 29 September to 5 October 2026
| Asset and candles | EUR/USD (binary), 5-minute candles recorded from IQ Option’s Practice traderoom: 1,334 candles in two stretches without gaps, 29 September 01:55 (open of the first candle) to 2 October 21:00 UTC (close of the last candle; 1,093 candles in this stretch) and 4 October 21:00 to 5 October 17:05 UTC (241 candles). The first 50 candles of each stretch are skipped as indicator warm-up, so 1,234 candles were scanned. The replay places no orders and uses the logged prices. |
|---|---|
| Rule tested | On 5-minute candles with RSI(14), CCI(20) and Williams %R(14): Higher when at least two of the three cross upward out of their lower zone (RSI above 30, CCI above -100, Williams %R above -80) on the signal candle or on one of the two candles before it; Lower for the mirror crossings (RSI below 70, CCI below +100, Williams %R below -20). The signal is the first closed candle on which at least two have crossed. Expiry one candle (5 minutes) after that close. The three-candle window is our own addition. The RSI is calculated with exponential smoothing (alpha 2 ÷ (period + 1)), the CCI on the typical price (high + low + close) ÷ 3, and Williams %R from the highest high and lowest low of 14 candles. |
| Signals | 114 signals (the first closed candle on which at least two of the three had crossed, with no signal on the next candle for the same setup). Two variants were run on the same candles: the crossings on the same candle only, 92 signals; all three within three candles, 56 signals. |
| Outcomes | Main rule: 54 won, 59 lost, 1 refunded. Win rate among decided trades 47.8% (54 of 113); net -$0.115 per $1 staked at an 85% payout. Same-candle variant: 43 won, 48 lost, 1 refunded (47.3%). All-three variant: 31 won, 24 lost, 1 refunded (56.4% of 55 decided trades). With about 55 to 113 decided trades, chance alone can move a win rate by ten points or more, so the gaps between the variants do not show that one is better. |
| Break-even | At an 85% payout a trade needs to win more than 54% of decided trades (1 ÷ 1.85); at 87%, 53.5%. |
This replay uses candles recorded from IQ Option’s Practice traderoom between 29 September and 5 October 2026 and placed no real orders. A short replay proves nothing about the future: it shows what one fixed reading of the rule did on those candles, and the three-candle window is our own addition. How an indicator is calculated also matters: with Wilder smoothing for the RSI instead, the same rule gave 96 signals (50 won, 45 lost, 1 refunded). Another asset, period or candle size can give a different result. Nothing here is a promise of profit or of any win rate.
Pros and Cons of the CCI RSI Strategy
| Pros | Cons |
|---|---|
| Each oscillator has fixed zones, so the rule can be written down and tested on candles. | The three are all oscillators, so they tend to move together. Two of them agreeing says less than two different kinds of tools would, and IQ Option’s blog advises combining indicators from different groups. |
| Needing two of the three crossings means that one indicator crossing on its own is not a signal. | Three panels under the price chart make a crowded screen. IQ Option’s blog says the more indicators you add, the messier your chart gets. |
| All three indicators are built in with the settings used here, and they can be saved as one template. | The levels do not predict the next candle. IQ Option’s RSI guide says so about its 70 and 30 levels, which describe what price has been doing. |
Common mistakes
- Entering on one oscillator alone. The rule needs at least two crossings.
- Counting an old crossing. A crossing counts only on the signal candle or on one of the two candles before it.
- Entering before the candle closes. The oscillator lines keep moving while a candle forms, so a crossing can appear and vanish within the candle. The rule and the library script use closed candles.
- Reading the three panels as three separate opinions. They are all oscillators calculated from the same prices, so they often agree without adding much information.
- Expecting a stop loss on a binary option. A binary option has no stop loss and no take profit; you choose the direction, the stake and the expiry. A CFD (margin) trade has both.
Conclusion
The CCI RSI strategy turns three oscillators into one fixed rule: at least two of them cross back out of their extreme zone within three candles, and you open Higher or Lower for one candle. In a replay on EUR/USD 5-minute candles from 29 September to 5 October 2026, the rule gave 114 signals and won 47.8% of its 113 decided trades, below the 54.1% break-even rate at an 85% payout; requiring all three crossings gave 56 signals and 56.4% of 55 decided trades, which is too few trades to say anything. The Practice balance uses virtual money and can be refilled to $10,000, so you can count your own results over many more trades there, and compare your win rate with the break-even rate for the payout you see.
Related guides
- RSI indicator trading at IQ Option
- Williams %R indicator at IQ Option
- Woodies CCI on IQ Option, which combines two CCI lines in one panel
- CCI divergence strategy at IQ Option
- Oscillators strategy for IQ Option
- Overbought and oversold markets
- Too many indicators on your chart
- DeMarker indicator at IQ Option
- Chart templates on IQ Option
- IQ Option scripts library, with the IQOW Three Oscillators script that marks this rule on your chart
- All indicator guides and all strategy guides
Frequently Asked Questions
Q: Which three indicators does the CCI RSI strategy use?
A: The Relative Strength Index (RSI), the Commodity Channel Index (CCI) and Williams %R. All three are oscillators with a lower and an upper zone.
Q: Which settings does the strategy use?
A: The CCI period is 20. The other two use the platform’s defaults: RSI period 14 with lines at 30 and 70, and Williams %R period 14 with lines at -80 and -20.
Q: Do all three oscillators have to cross?
A: No. The rule needs at least two of the three. The replay counts a signal when at least two have crossed within three candles, and the tested box also shows a stricter variant that needs all three.
Q: Which candle size and expiry does it use?
A: The rule uses 5-minute candles and an expiry equal to the candle length, so 5 minutes. The replay above used the 5-minute setting.
Q: Which assets suit the strategy?
A: We did not compare asset types, so we cannot say which suit it. IQ Option’s Help says it may change the profit percentage at any time, so read the payout next to the asset when you trade; on options it showed 82% to 91% between 2 and 4 October 2026.
Q: Why use RSI, CCI and Williams %R together?
A: Each one watches for a crossing back out of its extreme zone, and agreement between them is the signal. They are all oscillators, so they often move together. IQ Option’s blog advises combining indicators from different groups and warns that two indicators that do the same thing give “information overload”.
Q: What win rate does a trade need to make money?
A: At an 85% payout a trade needs to win more than 54% of decided trades to break even (1 ÷ 1.85); at 87%, 53.5%.
Q: Can I add the three oscillators as one script?
A: The IQ Option scripts library has IQOW Three Oscillators, which counts the crossings in one panel and marks the candle where at least two have happened. Import it as shown in our scripts guide.

