Last updated: 8 October 2026. Every screenshot below was recorded on 8 October 2026 on an IQ Option Practice account registered in Brazil, on EUR/USD 5-minute candles; the Chart analysis picture in Step 1 was recorded on 5 October 2026. We placed no real-money trade. The settings come from the platform’s dialog and the calculation from the published source code of the platform’s built-in indicators (Quadcode’s script library). The tested box shows what the level rule did with its own settings and with the platform’s on EUR/USD candles recorded between 29 September and 5 October 2026; it says nothing about what will happen next.
The DeMarker (DeM) compares each candle’s high and low with those of the candle before it. It averages the new highs and the new lows over a period and plots the share of the new highs, as a percentage from 0 to 100, in a panel under the price chart with two level lines. A high reading means the recent candles made more new highs than new lows; a low reading means the opposite. The platform opens it at period 13 with levels at 80 and 20, while the usual setting is period 14 with levels at 70 and 30, and the usual rule buys when the line rises back above 30 and sells when it falls back below 70. We tested both sets of settings on 5-minute EUR/USD candles; all five results are in the tested box.
Quick answer
- What it plots: one line from 0 to 100 in a panel under the price chart, with two level lines.
- Formula: DeM = SMA(new highs) ÷ (SMA(new highs) + SMA(new lows)) × 100, where a new high is the rise of the high above the previous high (or 0) and a new low is the fall of the low below the previous low (or 0).
- Settings on the platform: three: Period (13), Overbought (80) and Oversold (20). The usual setting is period 14 with levels 70 and 30.
- Reading: above the upper level the recent candles made mostly new highs (overbought), below the lower level mostly new lows (oversold); 50 is the neutral line.
- Where: the Momentum list of the Chart analysis panel; search for DeMarker.
- Tested: on EUR/USD 5-minute candles of 29 September to 5 October 2026 the level rule with the usual settings (14, 70, 30) won 45 of 84 decided trades (53.6%) at a five-minute expiry and 52 of 86 (60.5%) at fifteen minutes; with the platform’s defaults (13, 80, 20) it won 29 of 61 (47.5%) and 27 of 59 (45.8%). Break-even is 54.1% at an 85% payout; a short replay, no promise.
How do you add the DeMarker on IQ Option?
Set the chart
Choose the asset, the chart type and the candle size first: the indicator is calculated from the candles on the chart. The examples in this guide use 5-minute candles on EUR/USD. These steps use the web traderoom on a Practice balance, and the numbers in each screenshot match the numbers in the text. If you do not have an account yet, see how to register.
Step 1: Open Chart analysis
Click the indicators button (1), the wave icon in the chart toolbar at the bottom left of the chart. The Chart analysis panel opens with the tabs Indicators, Templates, Widgets and Scripts. Stay on Indicators.

Step 2: Find DeMarker
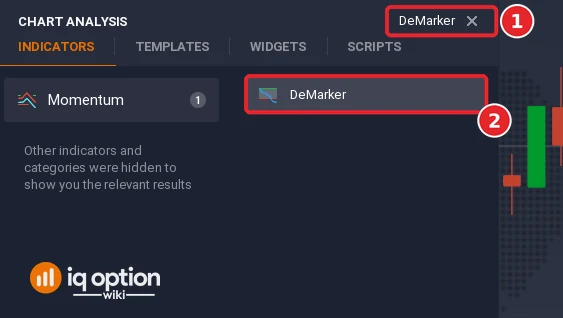
Type “DeMarker” in the Search for indicators box (1), or open the Momentum list, and click DeMarker (2).
Step 3: Check the settings
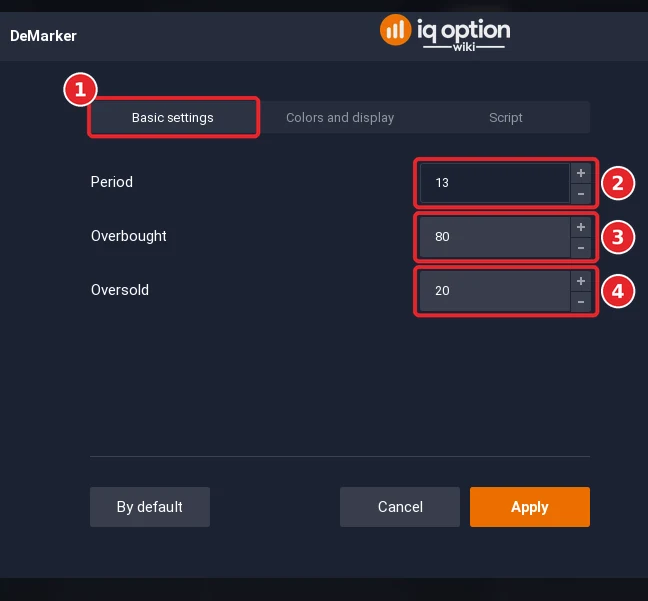
The dialog has three tabs: Basic settings (1), Colors and display and Script. The Period (2) opens at 13, the number of candles in the two averages. The Overbought (3) opens at 80, the upper level line. The Oversold (4) opens at 20, the lower level line.
Step 4: Check the colours and click Apply
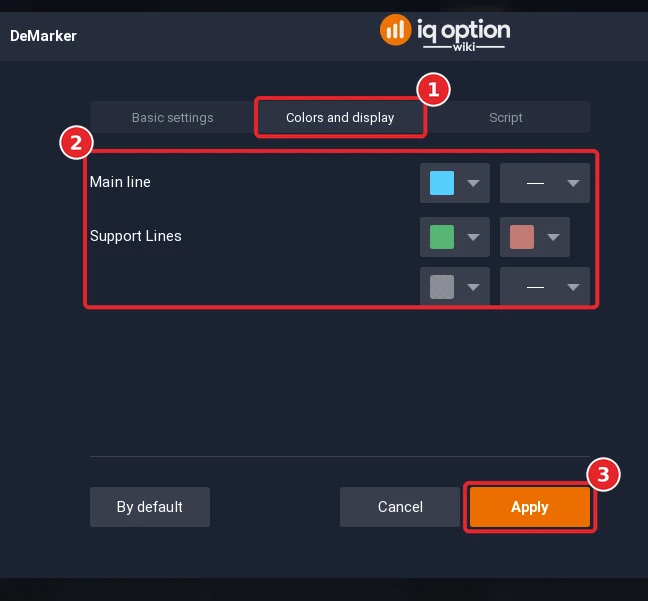
Open the Colors and display tab (1). The tab has a Main line row (light blue by default) and a Support Lines row (green for the upper level and red for the lower one), each with a colour box, and a last row with a grey colour and a line style. All the rows are in box 2. Click Apply (3).
Step 5: Read the panel
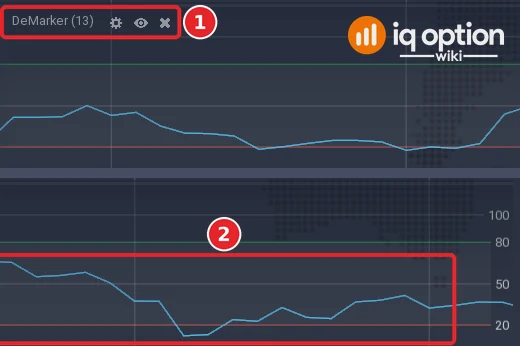
The DeMarker opens in a panel under the price chart. Its title is at the top left of the panel (1); the line (2) moves between 0 and 100 and the two dashed level lines at 80 and 20 are drawn on the panel.
How is the DeMarker calculated?
The Quadcode source uses highs and lows only, not closes. On every candle it takes DeMmax = the high minus the previous high, or 0 if that is negative, and DeMmin = the previous low minus the low, or 0 if that is negative. It averages each with a simple moving average over the period, and the DeMarker is 100 × average of DeMmax ÷ (average of DeMmax + average of DeMmin). If every one of the last candles made a higher high and none a lower low, the line is 100; in the reverse case it is 0. The indicator is credited to Thomas DeMark.
| Part | Default | What it does |
|---|---|---|
| Period | 13 | Number of candles in the two averages |
| Overbought | 80 | The upper level line |
| Oversold | 20 | The lower level line |
The usual description is that the DeM compares the current high and low with those of the previous bar and smooths the result with a simple moving average, which is what the source does, and that the line oscillates between 0 and 100.
How do you read the DeMarker?
Three key values are usually read, 70, 50 and 30: 70 is overbought, with a potential price drop; 50 is neutral, a ranging or non-trending market; 30 is oversold, with the possibility of a price increase. The usual advice is to set the period to 14 and the lines to 70 and 30 in the dialog. The rule is that when the DeM crosses the 30 line from below an uptrend may be coming and a long trade can be opened, and when it crosses the 70 line from above a downtrend may be coming and a short trade can be opened. False signals in strongly trending markets are the limit of the rule.
Because the platform opens at 80 and 20, the two sets of levels give different signals. A level is reached less often the further it is from 50, so the 80 and 20 lines give fewer signals than the 70 and 30 lines.
What did it look like on 5-minute candles?
We replayed the library script on EUR/USD 5-minute candles recorded from the Practice traderoom: 1,093 candles from 29 September 2026 (01:55 UTC) to 2 October (20:55 UTC) and 241 from 4 October (21:00 UTC) to 5 October (17:00 UTC). With the defaults the line has a value from the 14th candle of each stretch, 1,308 values in all.
- Defaults (13, levels 80 and 20): at or above 80 on 108 candles (8%) and at or below 20 on 175 (13%); the line crossed 50 105 times, about every 12 candles.
- The settings (14, levels 70 and 30): at or above 70 on 214 of 1,306 candles (16%) and at or below 30 on 357 (27%).
- Range: the line reached 100 and 0 in the recording.
The Step 5 picture covers 05:27 to 11:16 on the platform clock. With the default period the line reached 95.7 at 08:00 and fell to 12.2 at 10:10; it was at or above 80 on 18 candles and at or below 20 on 5. The level rule with the platform’s settings gave seven signals in that picture, on the candles that opened at 06:30, 07:00, 07:10 and 10:15 (Higher) and at 08:40, 08:55 and 09:20 (Lower), each with its option opened at the close of its candle. The three Lower signals all lost: after the 08:40 candle the price rose from 1.13479 to 1.1352, after the 08:55 candle from 1.13519 to 1.13582 and after the 09:20 candle from 1.13508 to 1.13525, because the line sat above 80 while the price kept going up. In a second window of our recording, 10:44 to 16:33 (not pictured), the line reached 94.7 at 15:30 and fell to 6.5 at 14:45. (The platform draws the value of a candle at the time the candle closes: the candle that opened at 07:55 sits at the 08:00 mark.)
The level rule, tested
We wrote the rule as an exact condition on closed candles: Higher on the candle where the DeM rises back above the lower level after being at or below it, and Lower on the candle where it falls back below the upper level after being at or above it, with the option opened at the close of the signal candle. No expiry is given, so the box shows the candle’s own length, three candles, and, on 1-minute candles, five candles.
Tested on IQ Option: the DeMarker level rule with two sets of settings, EUR/USD candles of 29 September to 5 October 2026
| Asset and candles | EUR/USD binary (regular, not OTC): 1,334 five-minute candles (2026-09-29 01:55 to 2026-10-02 20:55 UTC and 2026-10-04 21:00 to 2026-10-05 17:00 UTC); 1,505 one-minute candles (2026-10-02 18:23 to 2026-10-02 20:59 UTC and 2026-10-04 21:01 to 2026-10-05 19:28 UTC). The candles were recorded from IQ Option’s Practice traderoom. The replay places no orders; it only scores the rule on those closed candles, at an 85% payout. |
|---|---|
| Rule tested | The level rule on closed candles: Higher on the candle where the DeM rises back above the lower level after being at or below it, Lower where it falls back below the upper level after being at or above it; the option opens at the close of the signal candle. Run with the usual settings (period 14, levels 70 and 30) and with the platform’s defaults (13, 80 and 20); expiry one and three candles on 5-minute candles, five candles on 1-minute candles. |
| Signals | Usual settings: period 14, levels 70/30, 5-minute, 1 candle: 87 signals (49 Higher, 38 Lower) Platform defaults: period 13, levels 80/20, 5-minute, 1 candle: 61 signals (38 Higher, 23 Lower) Usual settings, 5-minute, 3 candles: 86 signals (48 Higher, 38 Lower) Platform defaults, 5-minute, 3 candles: 61 signals (38 Higher, 23 Lower) Usual settings, 1-minute, 5 candles: 88 signals (48 Higher, 40 Lower) |
| Outcomes | Usual settings: period 14, levels 70/30, 5-minute, 1 candle: 45 won, 39 lost, 3 tied; 53.6% of the 84 decided trades won; net −$0.01 per $1 staked at 85% (+$0.02 at 91%) Platform defaults: period 13, levels 80/20, 5-minute, 1 candle: 29 won, 32 lost, 0 tied; 47.5% of the 61 decided trades won; net −$0.12 per $1 staked at 85% (−$0.09 at 91%) Usual settings, 5-minute, 3 candles: 52 won, 34 lost, 0 tied; 60.5% of the 86 decided trades won; net +$0.12 per $1 staked at 85% (+$0.15 at 91%) Platform defaults, 5-minute, 3 candles: 27 won, 32 lost, 2 tied; 45.8% of the 59 decided trades won; net −$0.15 per $1 staked at 85% (−$0.12 at 91%) Usual settings, 1-minute, 5 candles: 47 won, 38 lost, 3 tied; 55.3% of the 85 decided trades won; net +$0.02 per $1 staked at 85% (+$0.05 at 91%) |
| Break-even | At an 85% payout a trade needs to win more than 54.1% of its decided trades to break even (1 ÷ 1.85); at 91%, more than 52.4% (1 ÷ 1.91). |
A replay is only a look back at candles recorded on the dates above: it placed no real orders, covers about four and a half days of one pair, and counts overlapping trades as if they were independent. A short test proves nothing about the future, and no profit and no win rate is promised here. IQ Option’s own blog on backtesting says that most strategies need dozens, and often hundreds, of trades before a result means anything.
With the platform’s own levels the rule lost more than it won at both expiries. With the usual settings it was close to even at five minutes and above the break-even rate at fifteen minutes, 52 wins against 34 losses, with an interval of 50% to 70%. Five readings were tried, so that one can be luck; it is not a result to trade on.
Pros and Cons of the DeMarker
| Pros | Cons |
|---|---|
| Built from highs and lows, so it reacts to new extremes, not to the close. | Overbought and oversold are not signals in a strong trend: false signals are the usual limit. |
| Bounded between 0 and 100 with two level lines and a neutral line at 50. | The platform’s levels (80 and 20) are not the usual ones (70 and 30), and they give different numbers of signals. |
| One setting, the period, and two level lines that can be moved. | The line often sits beyond a level for several candles before it turns back. |
Common mistakes
- Assuming the dialog opens at the usual settings. It opens at 13, 80 and 20; type 14, 70 and 30 to use the usual values.
- Treating overbought as a sell signal. The line can stay above the upper level while the price keeps rising.
- Comparing results across settings without a test. Different periods and levels give different signal counts; we list five readings.
- Using it alone. It is usually combined with moving averages, the ADX or the RSI.
Related guides
- RSI on IQ Option and Stochastic on IQ Option
- Williams %R on IQ Option and overbought and oversold markets
- Oscillators strategy and leading and lagging indicators
- All indicator guides and all strategy guides
Frequently Asked Questions
Q: What is the DeMarker indicator?
A: An oscillator that compares each candle’s high and low with the previous candle’s and plots the share of new highs against new lows, from 0 to 100. It is credited to Thomas DeMark.
Q: What settings does the DeMarker have on IQ Option?
A: Three: Period (13), Overbought (80) and Oversold (20). The colours and line styles of the main line and the level lines are on the Colors and display tab.
Q: What are the overbought and oversold levels?
A: The platform opens with lines at 80 and 20. The usual levels are 70 and 30, with 50 as the neutral line; both sets can be typed in the dialog.
Q: How do I trade with the DeMarker?
A: The usual rule buys when the line rises back above the lower level and sells when it falls back below the upper level. The results of that rule with both sets of settings are in the tested box.
Q: Does the DeMarker use the close?
A: No. The platform’s source uses the highs and the lows of the candles.
Q: Can I use the DeMarker on binary options?
A: The platform draws it on any chart. Whether a rule works is something to test on the Practice balance with the expiry you plan to use.