
Last updated: 8 October 2026. Every screenshot below was recorded on 8 October 2026 on an IQ Option Practice account registered in Brazil, and nothing was traded with real money. The defaults and the formula come from the Quadcode Script Library, the public source code of the platform’s built-in indicators, and the names of the areas from IQ Option’s blog. The tested box shows what an entry rule written from the areas did when replayed on EUR/USD 5-minute candles recorded between 29 September and 5 October 2026; it says nothing about what the rule will do next.
Belkhayate Timing redraws price as candles in a separate panel, measured from a 34-period centre in units of the average candle range. Lines at 4 and 8 above and below zero cut the panel into five areas: a neutral middle, a red area above (4 to 8), a green area below (-4 to -8), and an upper and a lower area beyond 8. IQ Option’s blog reads red as a possible sell zone, green as a possible buy zone and the middle as a place where entering is not recommended; the tested box shows what a rule built on those areas did on EUR/USD candles.
Quick answer
- Source-code defaults: Period 34, Range 1 = 4, Range 2 = 8, Smoothing Oscillator off.
- What it plots: candles measured from a centre: (price – 34-candle average of (high + low) ÷ 2) ÷ 34-candle average of (high – low). A reading of 4 is four average candle ranges above the centre.
- Five areas: upper (above 8), red (4 to 8), middle (-4 to 4), green (-8 to -4) and lower (below -8).
- IQ Option’s reading: red is a possible sell zone, green a possible buy zone, upper and lower are warning zones beyond them, and entering in the middle is not recommended.
- Where it is: indicators button, Chart analysis, Momentum list, Belkhayate Timing. It opens in its own panel under the price chart.
- Tested: 5-minute EUR/USD candles, 29 September to 5 October 2026. Rule 1 (first close beyond 4 or -4) gave 30 signals: 21 won, 9 lost at a 1-candle expiry. Rule 2 (beyond 8 or -8) gave 1 signal. At an 85% payout 54.1% of trades must win to break even; 30 trades prove nothing.
Belkhayate Indicator introduction
IQ Option’s blog says Belkhayate Timing is an oscillator designed by Mustapha Belkhayate “to calculate the center of the market movement gravity”. It says the indicator helps to identify favourable areas for buying and selling, the moments to enter the market, and possible reversal points, and that traders often use it together with channel indicators such as Bollinger Bands and with fractals.
In the Quadcode source the centre is the simple average of (high + low) ÷ 2 over the Period, 34 candles by default, and the scale is the simple average of (high – low) over the same period. Each candle’s open, high, low and close is plotted as (price – centre) ÷ scale, so the panel shows candles, green when the close is above the open and red when it is below. A reading of 4 means a price four average candle ranges above the centre, and -4 four ranges below it. The source puts no fixed upper or lower limit on the readings. Example with made-up numbers: if the 34-candle average of (high + low) ÷ 2 is 1.1000 and the average candle range is 0.0010, a candle that closes at 1.1040 is plotted at (1.1040 – 1.1000) ÷ 0.0010 = 4.
| Setting | Source-code default | What it does |
|---|---|---|
| Period | 34 | Length, in candles, of both averages: the centre and the scale |
| Range 1 | 4 | The inner lines, at 4 and -4: where the red and green areas begin |
| Range 2 | 8 | The outer lines, at 8 and -8: where the red and green areas end and the upper and lower areas begin |
| Smoothing Oscillator | Off | Matters only when the Oscillator line is switched on: the line then plots the average of high, low and close instead of the close |
| Oscillator line | Off | A line through the candles’ closes, switched off by default |
| Belkhayate candles | Shown | Candles drawn green when the close is above the open and red when it is below |
If you change Range 1 or Range 2, the lines and the areas move with them.
How to add the Belkhayate Timing to the chart on the IQ Option platform
These steps use the web traderoom on a Practice balance, with the chart type set to candlesticks. The numbers in each screenshot match the numbers in the text.
Step 1: Open Chart analysis
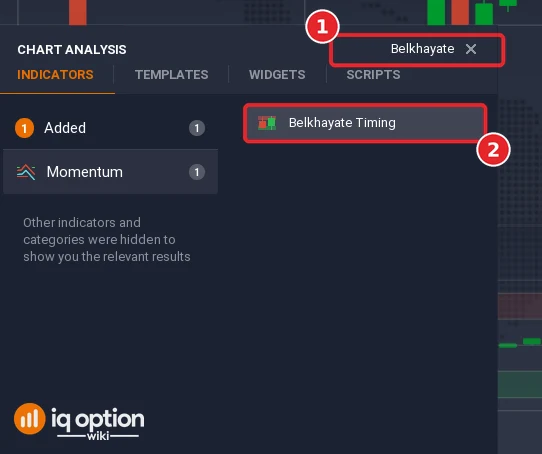
Click the indicators button (1), the wave icon in the chart toolbar at the bottom left of the chart. The Chart analysis panel opens with the tabs Indicators, Templates, Widgets and Scripts.

Step 2: Find Belkhayate Timing
On the Indicators tab, type “Belkhayate” in the search box (1) and click Belkhayate Timing (2). It sits in the Momentum list, where it is also the fourth entry. The indicator’s dialog opens on Basic settings, next to the Colors and display tab.
Step 3: Check the settings and apply
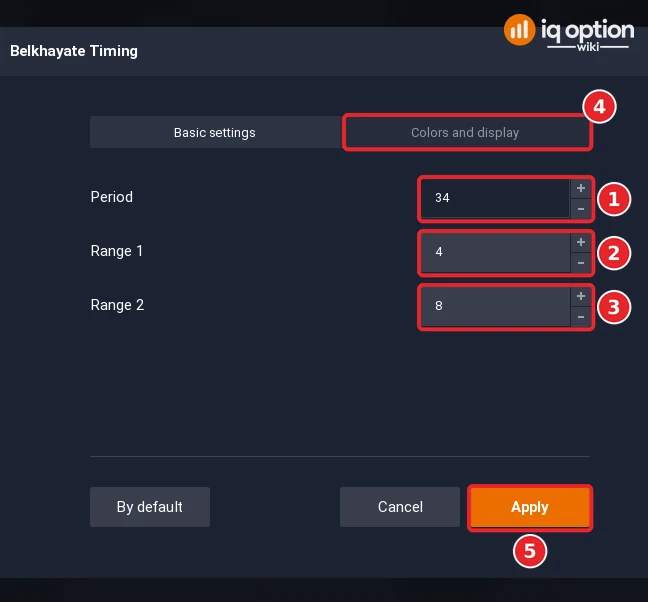
On Basic settings, Period (1), Range 1 (2) and Range 2 (3) show the defaults, 34, 4 and 8. The Smoothing Oscillator option of the source code is not on this tab. Colors and display (4) holds the colours of the candles, the lines, the area fill and the oscillator line. Click Apply (5).
Step 4: Read the panel
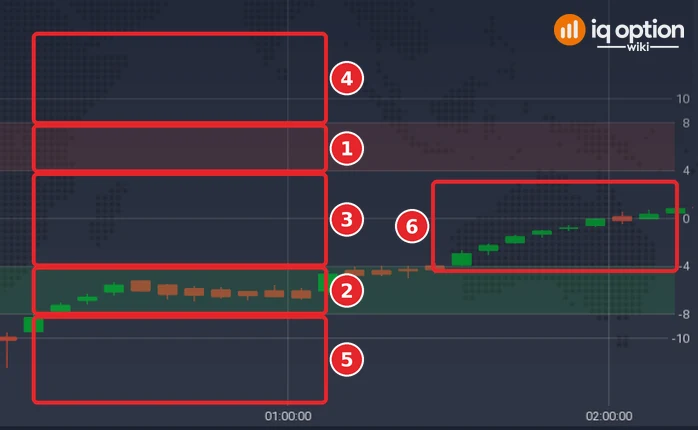
The indicator opens in its own panel under the price chart (titled BelkhayateTiming (4, 8), with a red band between 4 and 8, a green band between -4 and -8 and a scale of 10, 8, 4, 0, -4, -8 and -10). The lines at 4 and 8 and at -4 and -8 mark the areas: the red area (1) between 4 and 8, the green area (2) between -4 and -8, the middle area (3) between 4 and -4, and the upper (4) and lower (5) areas beyond 8 and -8, which have no fill. The Belkhayate candles (6) move through these areas. The panel starts small; to make the areas easier to tell apart we dragged the line between the price chart and the panel upwards, which made the panel taller.
How to use the Belkhayate Timing in trading on IQ Option
The indicator is read by the area in which a candle sits. IQ Option’s blog describes three kinds of area: the middle, the red and green extremes, and the transparent upper and lower areas beyond them. Counting the upper and lower areas separately gives five.
5 areas of the Belkhayate Timing
| Area | Close of the Belkhayate candle | Fill on the chart (source defaults) | What IQ Option’s blog says |
|---|---|---|---|
| Upper | above 8 | none | A warning zone beyond the red area; its signals are said to have a higher probability |
| Red | 4 to 8 | red | A possible sell signal |
| Middle | -4 to 4 | none | A neutral zone: entering is not recommended |
| Green | -8 to -4 | green | A possible buy signal |
| Lower | below -8 | none | A warning zone beyond the green area; its signals are said to have a higher probability |
IQ Option’s blog gives no figure for that higher probability. It also says traders often treat an entry as valid when the indicator lies between the lines 4 and 8 (or -4 and -8), and that the closer it is to 8 or -8, or beyond, the stronger the signal.
Trading with the Belkhayate Timing based on its 5 areas
The indicator measures distance from an average. The reading is that a price far above its centre, in the red or upper area, may fall back toward it, and a price far below, in the green or lower area, may rise back. The same distance means that price can stay in the red or green area for several candles while a trend continues, so the areas do not say when a move will turn. The rule below is our reading of the areas, on 5-minute candles:
- Middle area: no entry while the close stays between -4 and 4.
- Red and green areas: Lower when the close of the Belkhayate candle first moves above 4; Higher when it first moves below -4.
- Upper and lower areas: Lower when the close first moves above 8; Higher when it first moves below -8.
- Expiry: the indicator comes with no expiry rule. The test uses 1 candle (5 minutes) from the close of the signal candle, and a second run with 3 candles (15 minutes) that was declared in advance.
An entry rule has to be exact before a program can run it. We read “price” as the close of the Belkhayate candle and “entering” an area as the first close inside the area after a close outside it, because a program can only act on a closed candle.
Opening positions for price decreases
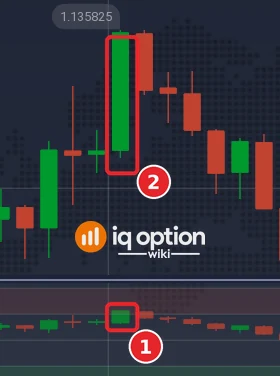
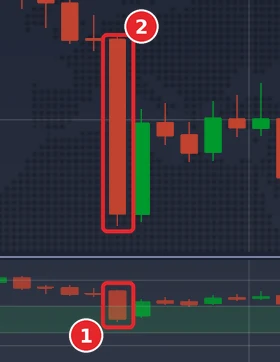
This is the first Lower signal of the replay, in time order and not picked by result: the 5-minute EUR/USD candle that opened at 12:00 UTC on Tuesday 29 September 2026 (09:00 on the platform clock). The Belkhayate candle (1) closed at 4.52 after a close of 2.84 on the candle before, so it was the first close above 4. The price candle (2) was a long green candle that closed at 1.135815. A Lower order opened at that close would have won after one candle (1.135515 at 12:10 UTC) and after three (1.135305 at 12:20 UTC).
Opening positions for price increases
This is the first Higher signal of the replay: the candle that opened at 07:30 UTC on the same day (04:30 on the platform clock). The Belkhayate candle (1) closed at -5.91 after -2.05, the first close below -4, and the price candle (2) was a long red candle that closed at 1.13435. A Higher order opened at that close would have won after one candle (1.134975 at 07:40 UTC) and after three (1.13477 at 07:50 UTC). The second Higher signal, the candle that opened at 09:10 UTC, won after one candle and lost after three; the tested box below reports every signal, not only these.
Tested on IQ Option: 8 October 2026
| Asset and candles | EUR/USD (binary, regular market), 5-minute candles recorded from IQ Option’s Practice traderoom: 1,334 candles in two unbroken runs, Tuesday 29 September 2026 01:55 to Friday 2 October 21:00 UTC (1,093 candles) and Sunday 4 October 21:00 to Monday 5 October 17:05 UTC (241). The first 50 candles of each run were skipped because the averages need 34, leaving 1,234 scanned candles. The replay uses recorded candles and placed no real orders. |
|---|---|
| Rule 1: red and green areas | 5-minute candles, Belkhayate Timing at its source-code defaults (Period 34, Range 1 = 4, Range 2 = 8), reading the close of the Belkhayate candle. Higher when the close first moves below -4 after the previous close was at or above -4; Lower when it first moves above 4 after the previous close was at or below 4. Opened at the close of the signal candle, expiring 1 candle (5 minutes) later. |
| Rule 2: upper and lower areas | The same, with the lines at 8 and -8: Higher when the close first moves below -8, Lower when it first moves above 8. Same candles, same expiry. |
| Signals and outcomes, rule 1 | 30 signals (21 Higher, 9 Lower). With a 1-candle expiry: 21 won, 9 lost, none refunded, which is 70.0% of decided trades (Higher 14 of 21, Lower 7 of 9) and a net gain of $8.85 on $30 staked at an 85% payout. With a 3-candle (15 minute) expiry on the same signals, declared in advance as a second run: 18 won, 12 lost, 60.0%, a net gain of $3.30. |
| Signals and outcomes, rule 2 | 1 signal (Higher, Monday 5 October 02:15 UTC), which lost at both the 1-candle and the 3-candle expiry. One trade says nothing about the rule. The close went below -8 on 12 scanned candles, but only one of them was the first close beyond the line. |
| Time in each area | Of 1,234 scanned candles the Belkhayate close was in the middle area on 1,126 (91.2%), the green area (-8 to -4) on 70 (5.7%), the red area (4 to 8) on 26 (2.1%), the lower area (below -8) on 12 (1.0%) and the upper area (above 8) on none. The readings ran from about -12.6 to +7.7 on these candles, so they are not limited to a fixed range. |
| Break-even | At an 85% payout a trade needs to win more than 54% of the time to break even (1 ÷ 1.85); at 87%, about 53.5%. |
This is one short replay on about a week of recorded candles from one asset, placed no real orders, and the rules are our own reading of the indicator’s areas, because it comes with no entry or expiry rule. It proves nothing about how either rule will behave next, and no profit or win rate is promised.
Combining Belkhayate Timing with other indicators
IQ Option’s blog says traders often use Belkhayate Timing with channel indicators such as Bollinger Bands and with fractals. No combination has been tested here. Our guides cover Bollinger Bands and the Fractal indicator.
Pros and Cons of the Belkhayate Timing Indicator
| Pros | Cons |
|---|---|
| It turns the distance from a 34-candle centre into a fixed set of areas, so “far above” and “far below” are defined. | The areas measure distance, not timing: price can stay in the red or green area while a trend continues. |
| Range 1, Range 2 and Period let you move the areas and change the length of the centre. | It comes with no entry or expiry rule; the rule tested here is our own reading. |
| It opens in its own panel, so it does not cover the price chart. | The centre and the scale are simple averages, so one very large candle shifts both for the next 34 candles. |
Common mistakes
- Mixing up the candle colour and the area colour. A Belkhayate candle is green when it closes above its open. That is not the green area, which is the band between -8 and -4.
- Entering in the middle area. IQ Option’s blog says it is a neutral zone and not recommended.
- Expecting readings between 0 and 100. The source puts no fixed limit on them.
- Changing Range 1 or Range 2 and keeping the old area names. The areas move with the lines.
Final words
Belkhayate Timing shows how far price is from its 34-candle centre, in units of the average candle range, and splits that distance into five areas. IQ Option’s blog reads the red and green areas as possible sell and buy zones. Whether a rule built on them pays depends on the payout, the asset and the expiry: at an 85% payout a trade needs to win more than 54% of the time to break even. Try the rule on a Practice balance over a few hundred trades before you risk money.
Related guides
- Bollinger Bands on IQ Option
- Combining Bollinger Bands and RSI
- Fractal indicator on IQ Option
- MACD, Parabolic SAR and EMA strategy
- All indicator guides and all strategy guides
Frequently Asked Questions
Q: What is the Belkhayate Timing indicator?
A: An oscillator designed by Mustapha Belkhayate “to calculate the center of the market movement gravity”, according to IQ Option’s blog. In the Quadcode source it plots price as candles measured from a 34-period centre in units of the average candle range.
Q: What are the default settings of Belkhayate Timing?
A: A Period of 34, Range 1 of 4, Range 2 of 8 and Smoothing Oscillator off in the source code. On the platform, the Basic settings tab shows Period, Range 1 and Range 2 with 34, 4 and 8.
Q: What do the five areas mean?
A: The middle area (-4 to 4) is neutral. The red area (4 to 8) is a possible sell zone and the green area (-8 to -4) a possible buy zone, and the upper and lower areas beyond 8 and -8 are warning zones, according to IQ Option’s blog.
Q: How do I add Belkhayate Timing to the chart?
A: Click the indicators button at the bottom left of the chart, open the Momentum list in Chart analysis, click Belkhayate Timing and click Apply.
Q: Can I combine it with other indicators?
A: IQ Option’s blog says traders often combine it with channel indicators such as Bollinger Bands and with fractals. No combination has been tested here.
Q: Does it work on every asset and candle size?
A: It is calculated from the candles the chart shows, so it can be added on any asset and candle size. The tested box covers one asset (EUR/USD) and one candle size only, and a short test proves nothing about the future.

