
Last updated: 8 October 2026. Every screenshot below was recorded on 8 October 2026 on an IQ Option Practice account registered in Brazil, on EUR/USD 5-minute candles; the Chart analysis picture in Step 1 was recorded on 5 October 2026. We placed no real-money trade. The settings come from the platform’s dialog and the calculation from the published source code of the platform’s built-in indicators (Quadcode’s script library). This guide has no tested box: there is no entry rule for the filter, so it shows what the line did on recorded candles, not how often a reading works.
The Vertical Horizontal Filter (VHF) measures how directional the price has been. It divides the distance between the highest high and the lowest low of the last 28 candles by the sum of the candle-to-candle changes of the close over the same candles: a high value means the price travelled a long way in one direction, a low value means it moved a lot but ended near where it started. It is drawn as one line in a panel under the chart and gives no direction. On the 1,278 values we replayed for EUR/USD 5-minute candles it had a median of 0.40, was above 0.5 on 235 candles and above 0.7 on 45.
Video tutorial
Quick answer
- What it plots: one line in a panel under the price chart.
- Formula: VHF = (highest high − lowest low of the last n candles) ÷ (the sum of the absolute changes of the close from one candle to the next over the same n candles). The default n is 28.
- Settings on the platform: one: Period, 28 candles by default.
- Reading: a rising line means the price is moving in one direction (up or down); a low, flat line means a choppy range. It never says which direction.
- Where: the Trend list of the Chart analysis panel; search for Vertical.
- Not tested here: the idea that an extreme low value comes before a new trend and an extreme high value before its end is explained, not tested.
How do you add the Vertical Horizontal Filter on IQ Option?
Set the chart
Choose the asset, the chart type and the candle size first: the indicator is calculated from the candles on the chart. The examples in this guide use 5-minute candles on EUR/USD. These steps use the web traderoom on a Practice balance, and the numbers in each screenshot match the numbers in the text. If you do not have an account yet, see how to register.
Step 1: Open Chart analysis
Click the indicators button (1), the wave icon in the chart toolbar at the bottom left of the chart. The Chart analysis panel opens with the tabs Indicators, Templates, Widgets and Scripts. Stay on Indicators.

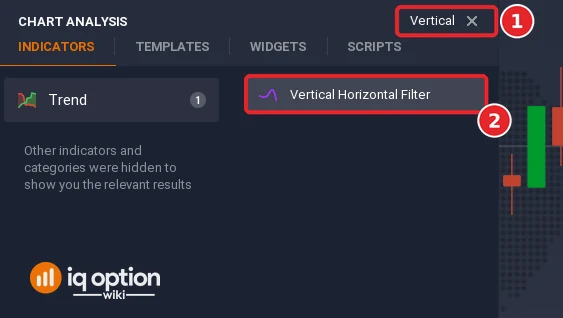
Step 2: Find Vertical Horizontal Filter
Type “Vertical” in the Search for indicators box (1), or open the Trend list, and click Vertical Horizontal Filter (2).
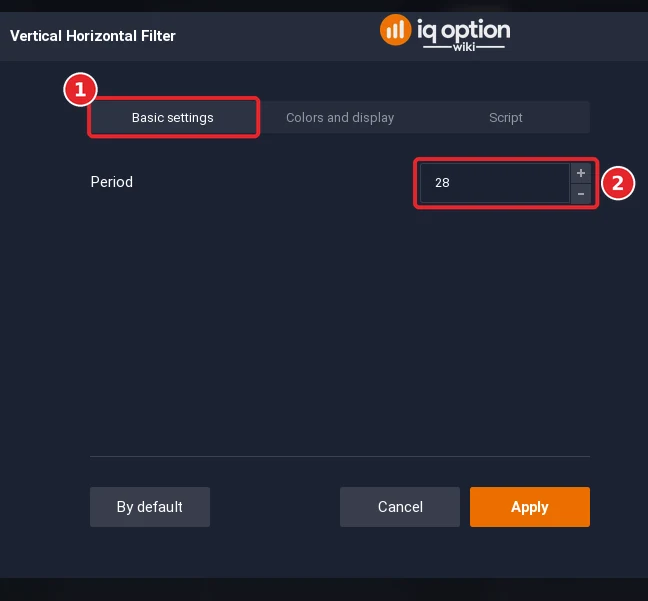
Step 3: Check the settings
The dialog has three tabs: Basic settings (1), Colors and display and Script. The Period (2) opens at 28, the number of candles in the range and in the sum of changes.
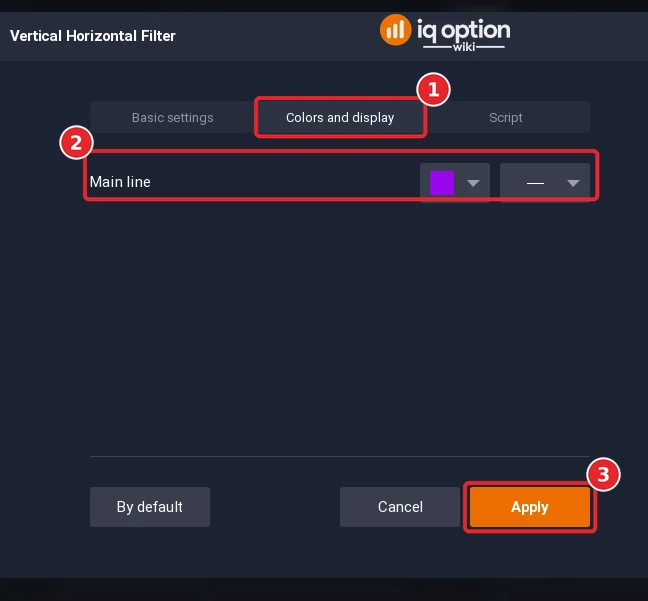
Step 4: Check the colours and click Apply
Open the Colors and display tab (1). The tab has one row, Main line (2), with a colour box, purple by default, and a line-style box. The colour and the style only change how the line looks. Click Apply (3).
Step 5: Read the panel
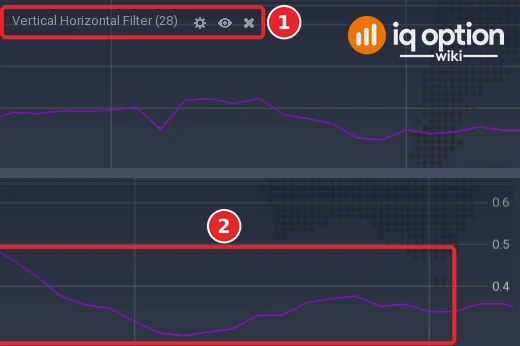
The filter opens in a panel under the price chart. Its title, Vertical Horizontal Filter (28), with the period in brackets, is at the top left of the panel (1), and the purple line (2) moves between about 0.3 and 0.6 on the axis at the right in this window. A rising line means that the price moved in one direction over the last 28 candles; a falling line means that it moved back and forth.
How is the Vertical Horizontal Filter calculated?
The formula is VHF = (highest high − lowest low) ÷ sum of |close − previous close|, all over the last n candles, with n = 28 by default. The numerator is the width of the range the price covered; the denominator is the length of the path the close took through it. If the price moved straight from the bottom of the range to the top, both are almost equal and the VHF is close to 1. If it went up and down many times inside the same range, the path is much longer than the range and the VHF is small.
The usual formula takes the highest and lowest closing prices for the numerator. The platform’s source uses the highest high and the lowest low of the candles, so the line can be larger than the closing-price version; on our recorded candles it went above 1 once, which the closing-price version cannot do. The indicator was introduced in 1991 by Adam White.
| Part | Default | What it does |
|---|---|---|
| Period | 28 candles | Number of candles in the range and in the sum of changes |
How do you read the Vertical Horizontal Filter?
The line does not point up or down with the price: it measures how much of the price movement was in one direction. The usual reading is that a rising VHF means a trend is getting stronger, up or down, and a falling or low VHF means the market is ranging. An extremely low value can come before a new trend and an extremely high value can mean the trend is exhausted, and the filter gives no trading signals or direction. We did not test those two ideas about the extremes.
Because the range comes from the last 28 candles, the line also moves when an old candle leaves the window, not only when a new candle arrives. That makes a sudden drop of the line possible without any new price move.
What did it look like on 5-minute candles?
We replayed the library script on EUR/USD 5-minute candles recorded from the Practice traderoom: 1,093 candles from 29 September 2026 (01:55 UTC) to 2 October (20:55 UTC) and 241 from 4 October (21:00 UTC) to 5 October (17:00 UTC). With a period of 28 the line has a value from the 29th candle of each stretch, so 1,278 values in all.
- Typical level: median 0.40; the middle 80% of the values lay between 0.28 and 0.56.
- Trending moments: above 0.5 on 235 candles (18%), above 0.7 on 45, above 1.0 on one.
- Choppy moments: below 0.3 on 208 candles (16%); the lowest value was 0.20, on the candle of 29 September that opened at 22:20 on the platform clock (01:20 UTC on the 30th).
The Step 5 picture covers 05:27 to 11:16 on the platform clock. The line peaked at 0.56 at 09:15: the highest high and the lowest low of the last 28 candles were 24.9 pips apart, while the closes had travelled 44.8 pips in total (24.9 ÷ 44.8 = 0.56). At 10:10 it was down to 0.28, because the range had shrunk to 14.9 pips against a path of 53.0 pips. (The platform draws the value of a candle at the time the candle closes: the candle that opened at 09:10 sits at the 09:15 mark.)
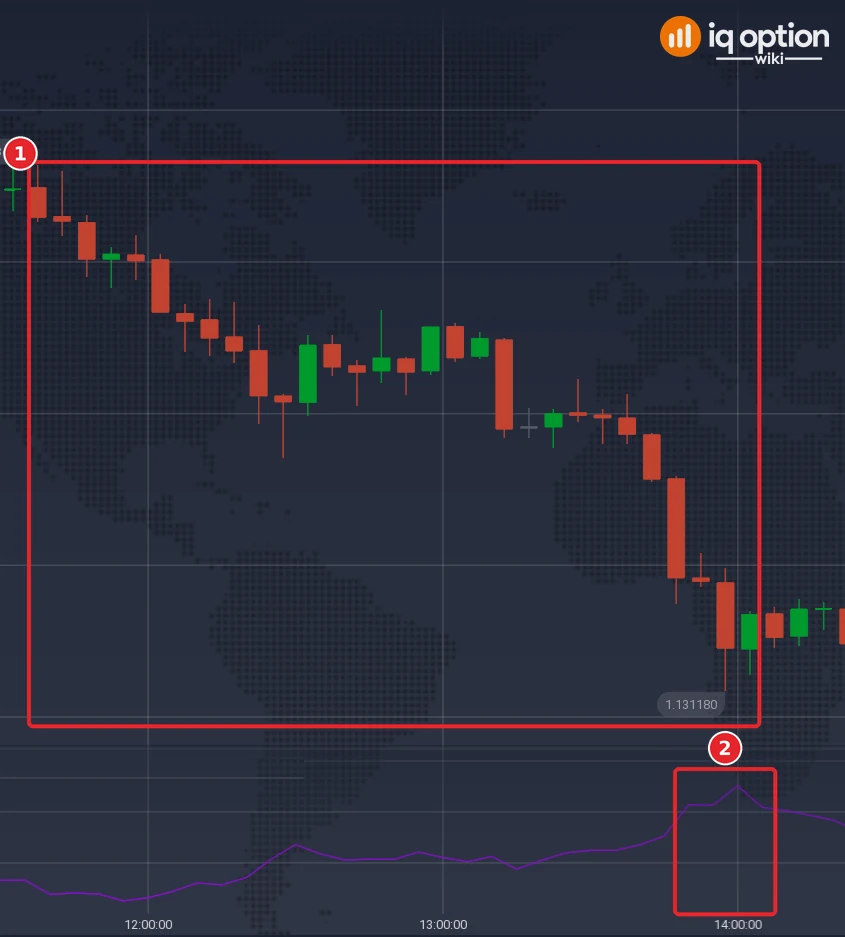
In the example picture below, from 10:44 to 16:33, the line reached 0.70 at 14:00. The price had fallen from 1.13427 to 1.13146 within the 28 candles, a range of 34.1 pips for a path of 48.6 pips (box 1), and the line (box 2) is at its peak. The lowest value of that picture, 0.25 at 11:55, was a range of 12.4 pips for a path of 49.6 pips.
Pros and Cons of the Vertical Horizontal Filter
| Pros | Cons |
|---|---|
| One number that says whether the recent price movement was directional or choppy. | It gives no direction, and no entry or exit. |
| Simple formula: one range and one sum, with a single setting, the period. | With the highest high and lowest low in the numerator, one wide candle can push the value up. |
| Helps decide which kind of tool to use: a trend-following one when it is high, a range tool when it is low. | The levels that count as high or low depend on the asset and the candle size; fixed thresholds are a guess. |
Common mistakes
- Reading a high VHF as a buy signal. It rises in a downtrend as well as in an uptrend.
- Using fixed thresholds from another asset. On our EUR/USD candles the middle 80% of the values was 0.28 to 0.56; look at your own chart.
- Expecting the closing-price formula. The platform uses the highest high and lowest low, so values above 1 are possible.
- Treating an extreme as a forecast. The idea about extremes was not tested here.
Related guides
- Identifying a trend and trading a ranging market
- Aroon on IQ Option and Trend Intensity Index
- Random Walk Index and leading and lagging indicators
- All indicator guides and all strategy guides
Frequently Asked Questions
Q: What is the Vertical Horizontal Filter?
A: An indicator that compares the distance between the highest high and the lowest low of the last n candles with the length of the path the close took. A high value means the price moved in one direction; a low value means it moved back and forth.
Q: What settings does the Vertical Horizontal Filter have on IQ Option?
A: One: the Period, 28 candles by default. The colour and line style of the Main line are on the Colors and display tab.
Q: Does the VHF show the direction of the trend?
A: No. The line rises in uptrends and in downtrends alike.
Q: What is a high or a low VHF value?
A: There is no fixed level. On our 1,278 EUR/USD 5-minute values the median was 0.40 and 90% were below 0.56, but another asset or candle size will differ.
Q: Can the VHF be above 1?
A: With the platform’s formula, yes: it uses the highest high and the lowest low, and it was above 1 on one candle in our recording.
Q: Does the VHF give trading signals?
A: No. It needs other tools to choose the entry and the exit.

