
Last updated: 8 October 2026. Every screenshot below was recorded on 8 October 2026 on an IQ Option Practice account registered in Brazil, on 5-minute EUR/USD candles of 29 and 30 September 2026 scrolled back on the same chart, and no real-money trade was placed. Times are the traderoom clock, which is UTC minus three hours, and a candle is named by the time it opens. The numbers in the tested box come from a replay on one week of candles and say nothing about what the ADX will do next. Nothing here is a promise of profit.
A ranging market is one in which the price moves sideways between a ceiling and a floor instead of going up or down. This guide looks at two tools for spotting it, the EMA 200 and the ADX: how to add both, what each looked like in a range and in a rise on the same pair, and what the ADX said about the next 15 minutes in a week of candles. In our two examples the ADX separated the range (11.6 to 26.7) from the rise (31.8 to 77.2) better than the slope of the EMA 200, which looked flat in both, and in the test a low ADX did not make a direction call worse.
Quick answer
- What it is: a ranging market moves sideways between a ceiling and a floor; a trending market moves up or down.
- EMA 200: Chart analysis, Moving Average, Period 200, Type EMA (the dialog opens on SMA). On 5-minute candles it covers about 16 hours and turns slowly: -0.42 pip an hour in our range and +0.34 to +0.73 pip an hour in our rise.
- ADX: Chart analysis, Average Directional, Period 14. The yellow line is the strength, +DI (green) and -DI (red) give the direction. IQ Option’s blog: 0 to 25 an absent or weak trend, 25 to 50 strong.
- Our examples: range of 29 September 20:55 to 23:25: ADX 11.6 to 26.7, closes 0.1 to 6.1 pips under the EMA 200. Rise of 30 September 02:00 to 03:25: ADX 31.8 to 77.2, close up to 14.9 pips above the EMA 200.
- Tested: following +DI and -DI at 15 minutes won 59.8% of decided trades when the ADX was under 20, 56.7% from 20 to 25 and 51.0% at 25 or more. Break-even is 54.1% at an 85% payout; the sample is one week. With 103 trades the win rate has a margin of error of about ±5 points (one standard error), so 59.8% cannot be told from break-even.
What is a ranging market?
A market can be described in two phases: trending, with a general movement up or down and corrections inside it, and ranging, in which the price swings without going anywhere. The ceiling and the floor of a range are resistance and support levels; see our guide on support and resistance lines.
How do you add the EMA 200 and the ADX on IQ Option?
These steps use the web traderoom on a Practice balance. The numbers in each picture match the numbers in the text.
Step 1: Open Chart analysis
Click the indicators button (1), the wave icon in the chart toolbar at the bottom left of the chart. The Chart analysis panel opens with the tabs Indicators, Templates, Widgets and Scripts.

Step 2: Add the EMA 200
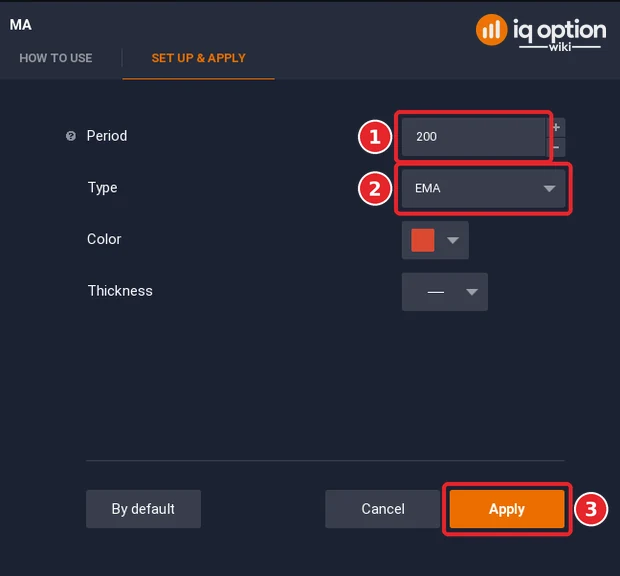
Type Moving Average in the search box and click the result. The dialog opens with Period 14 and Type SMA. Type 200 in Period (1), choose EMA in the Type list (2) and click Apply (3). The line is drawn over the candles.
Step 3: Add the ADX
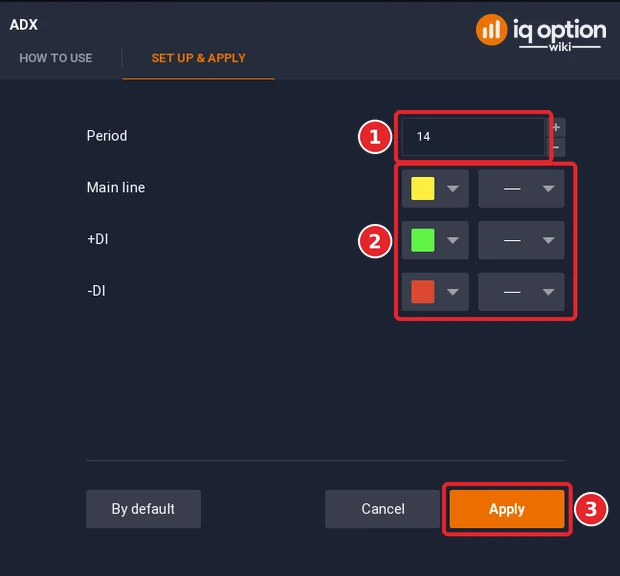
Type Average Directional in the search box and click the first result; its dialog is titled ADX. The settings can stay as they are: Period 14 (1) and three lines, the main line in yellow, +DI in green and -DI in red, each with a line style (2). Click Apply (3). The indicator appears in its own panel under the price, headed ADX (14).
How do you tell a ranging market from a trending one?
Method 1: the slope of the EMA 200
The usual rule is that a steep line means a strong trend and a flat line with small ups and downs means a range. On a 5-minute chart the EMA 200 averages the last 200 candles, about 16 hours, so it turns slowly. In our range example, 29 September from 20:55 to 23:25, it fell from 1.134207 to 1.134103, about 1 pip in 2.5 hours (-0.42 pip an hour). In our rise, 30 September from 02:00 to 03:25, it rose from 1.133931 to 1.133979, 0.48 pip in 1.4 hours (+0.34 pip an hour), and by 2.2 pips in the three hours to 05:00 (+0.73 pip an hour), while the price rose 22.3 pips by 03:25 and 16.9 pips by 05:00. Both lines look nearly flat on the screen, so on this chart the slope alone did not tell the two examples apart by eye. (The values of the average are from our replay; the line the platform draws agreed with them to within about 0.3 pip.)
Method 2: the distance between the price and the EMA 200
The usual rule is that in a trend the price stays further away from the line, and in a range the candles develop close to it. In the range example the closes stayed under the EMA 200 and never crossed it, between 0.1 and 6.1 pips below it. In the rise the close crossed the line once, at the 02:45 candle (1.13400 against 1.13390), and at 03:25 it was 14.9 pips above it. A distance of 15 pips against 6 separates the two examples more clearly than the slope does, but it is a rule of thumb from two examples, not a threshold.
Method 3: the level of the ADX
The ADX measures how strong a trend is, not which way it goes. IQ Option’s blog says “The ADX values range from 0 to 100, with 0 being an equivalent of the absolutely flat market and 100 — a very powerful trend” and gives a table: 0 to 25 is an absent or weak trend, 25 to 50 a strong trend, 50 to 75 a very strong trend and 75 to 100 an extremely strong trend. It also says that “the ADX (the yellow line) demonstrates only the trend strength and not the direction of the trend” and warns that “The ADX may sometimes be lagging behind the actual trend and can, therefore, provide outdated information.”
Two examples from the chart
A range: 29 September, 20:55 to 23:25
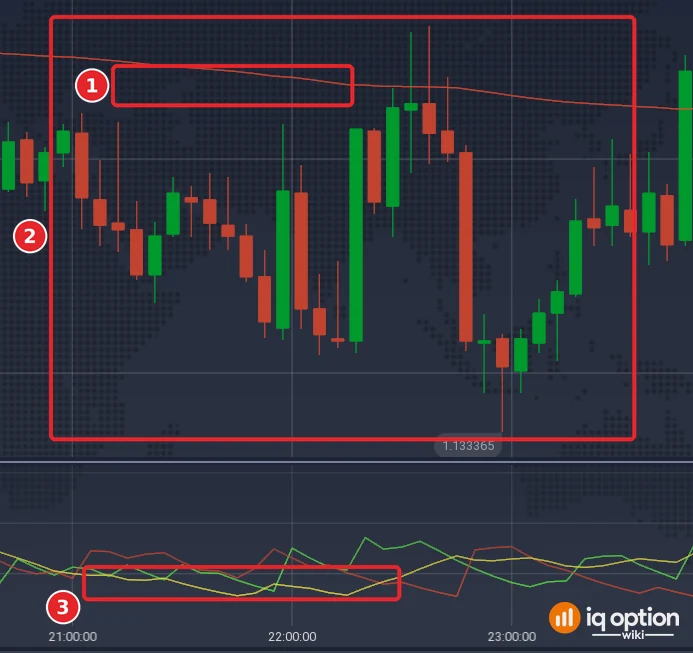
In 2.5 hours (31 candles) the price stayed between 1.133365 and 1.134310, a band of 9.45 pips, and the closes between 1.133515 and 1.134130 (2). The EMA 200 (1) lay just above the closes. The ADX line of the panel (3) read 19.6 at 21:00, fell to 11.6 at 21:40 and stayed under 20 until 22:25. It then rose to 26.7 at 22:40 and was back under 25 at 23:10, with the price still inside the same band. Over the whole stretch the panel read from 11.6 to 26.7, with a median of 18.8: weak trend by the blog’s table, with one short visit above 25.
A rise: 30 September, 02:00 to 03:25
In 85 minutes (18 candles) the close went from 1.133240 to 1.135470, 22.3 pips, and the high reached 1.135725 at the 03:25 candle; the steepest part of the rise, the candles from 02:25 to 03:30, is boxed (2). The EMA 200 (1) stayed almost where it was. The ADX (3) was already 31.8 at 02:10, because the price had been falling for two hours before the rise, passed 50 at 02:45 and peaked at 77.2 at 03:25 and 03:30, which the blog’s table calls extremely strong. It was still at 60.3 at 04:15 and back to 43.1 at 04:40, long after the top of the move.
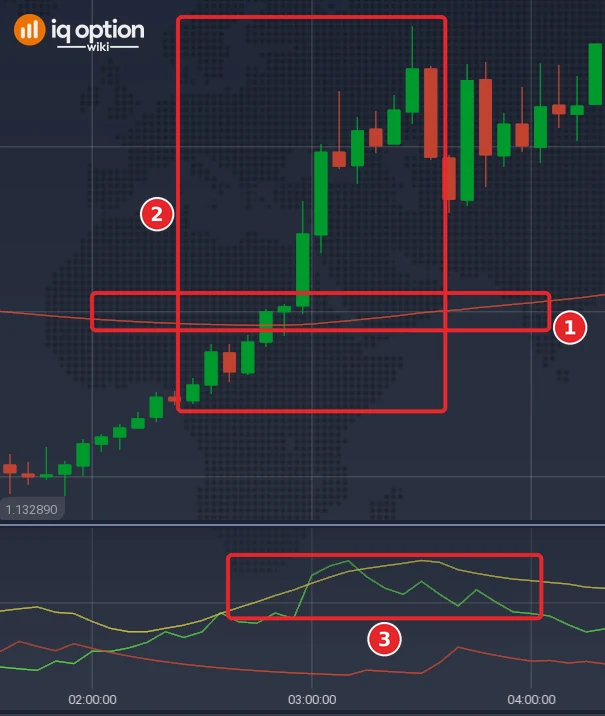
Two readings from the examples. First, the ADX looks backwards: it was already high when the rise began, because the price had fallen for two hours before it, and it was still above 40 more than an hour after the top. Second, it read low in the range and high in the rise, as the blog’s table says, but it never told us which way the price would go.
Tested on IQ Option: what the ADX said about the next 15 minutes, EUR/USD candles of 29 September to 5 October 2026
| Asset and candles | EUR/USD (binary), 5-minute candles recorded from IQ Option’s Practice traderoom: 1,334 candles in two stretches without gaps, 1,093 candles from 29 September 01:55 UTC to 2 October 21:00 UTC and 241 candles from 4 October 21:00 UTC to 5 October 17:05 UTC. The traderoom clock used for the times in the guide is UTC minus three hours. Nothing was traded. |
|---|---|
| ADX used | The platform does not publish its ADX formula. We used an ADX(14) with exponential smoothing of 14 candles for the true range, the directional movements and the ADX itself, and checked it against the values read from the platform’s panel: on 65 candles of the 30 September window it differed by 1.8 points (median) and on 71 candles of the 29 September window by 2.4 points. A library script that looks like the ADX did not match the panel (49 against 77 at 03:25 on 30 September), so it was not used. |
| Rule replayed | On every closed candle from the 61st of each stretch up to the fourth from last (so that the 15-minute outcome exists): Higher if +DI is above -DI, Lower if it is below, opened at the close of that candle and held 15 minutes (3 candles), at an 85% payout. The candles were sorted by the ADX on that candle: under 20, 20 to 25, 25 or more. Each candle counts, so trades overlap. |
| ADX under 20 | 103 candles: 61 won, 41 lost, 1 refunded; 59.8% of the decided trades won (95% interval 50.1% to 68.8%); the price moved 2.63 pips on average in the 15 minutes, in either direction. |
| ADX 20 to 25 | 171 candles: 97 won, 74 lost; 56.7% (95% interval 49.2% to 63.9%); average move 4.13 pips. |
| ADX 25 or more | 934 candles: 474 won, 455 lost, 5 refunded; 51.0% (95% interval 47.8% to 54.2%); average move 3.65 pips. This was 77% of the 1,208 candles counted (1,334 minus the first 60 and the last 3 of each stretch). |
| Check with the ADX moved by 3 points | With every ADX value 3 points higher: under 20 won 66.0% of 47 candles and 25 or more won 51.6%. With every value 3 points lower: under 20 won 56.6% of 206 candles and 25 or more won 51.2%. |
| Break-even | At an 85% payout a trade has to win about 54.1% of the time (1 / 1.85). |
The replay places no orders and has no spread. The week was mostly one-directional (EUR/USD fell 108 pips in the first stretch and 56 pips in the second), which is why the ADX was 25 or more on three candles out of four, and the low-ADX groups are small. Neighbouring candles overlap, so the trades are not independent, and the intervals overlap each other, so the test does not show that a low ADX is better or worse than a high one. It measures whether following the +DI and -DI direction was right, not whether a ranging market is worse to trade: that would need a rule for what to do inside a range. No profit is promised. Repeat the idea on your own Practice balance before you risk money.
Pros and cons of detecting ranging markets
| Pros | Cons |
|---|---|
| The EMA 200 and the ADX are built into the platform and cost nothing. | The EMA 200 on a 5-minute chart turns so slowly that two very different hours looked equally flat. |
| The ADX gives a number, so the reading does not depend on the eye. | The ADX looks backwards: it was high when the rise began and stayed high after the top. |
| In our two examples the ADX separated the range (11.6 to 26.7) from the rise (31.8 to 77.2). | In our test, following +DI and -DI at 15 minutes won 59.8% of decided trades when the ADX was under 20 and 51.0% at 25 or more, so staying out when the ADX is low is not supported by a week of data. |
| The platform lists many assets, so another chart is a click away when one is ranging. | None of the three readings says when a range will end. |
Common mistakes
- Reading the ADX as a direction. The yellow line is strength only; direction comes from the +DI and -DI lines, and the blog says so.
- Waiting for the ADX to fall below 20 or 25 before you call a range. It is a backward-looking number: the blog warns that it can lag, and in our rise it was still above 40 more than an hour after the top.
- Judging the EMA 200 slope by eye on a 5-minute chart. In our examples it moved 0.3 to 0.7 pip an hour in the rise and -0.4 pip an hour in the range.
- Treating the level 25 as a switch. The blog’s table has four bands, and our range example went above 25 at 22:40 and was back under it at 23:10, with the price still inside the same band.
- Forgetting the payout. At an 85% payout an option has to win about 54.1% of the time to break even.
Related guides
- Support and resistance lines on IQ Option
- Triangle patterns on IQ Option
- Trendline combined with support and resistance
- Leading and lagging indicators
- All indicator guides and all strategy guides
Frequently Asked Questions
Q: How do I identify a ranging market on IQ Option?
A: Look at three things: the EMA 200 (flat, with the candles close to it), the distance of the price from it, and the ADX (under 25 by the blog’s table). In our two examples the ADX and the distance separated the range from the rise better than the slope did.
Q: What ADX level means a ranging market?
A: IQ Option’s blog calls 0 to 25 an absent or weak trend and 25 to 50 a strong one. In our range example the panel read 11.6 to 26.7.
Q: Does the ADX show the direction of the trend?
A: No. The blog says the yellow line shows only the strength; the +DI and -DI lines show the direction.
Q: Is it better to trade a trending market than a ranging one?
A: In our replay of a week of candles, following the +DI and -DI direction at 15 minutes won 51.0% when the ADX was 25 or more and 59.8% when it was under 20, so we could not confirm that trends are easier to trade; the sample is small and the week was mostly one-directional.
Q: Can I use these tools on other candle sizes?
A: The platform draws both on any chart. We tested only 5-minute EUR/USD candles, and the EMA 200 covers a different length of time on every candle size.

