
Last updated: 8 October 2026. Every screenshot below was recorded on 8 October 2026 on an IQ Option Practice account registered in Brazil, on EUR/USD 5-minute candles; the Chart analysis picture in Step 1 was recorded on 5 October 2026. We placed no real-money trade. The settings come from the platform’s dialog and the calculation from the published source code of the platform’s built-in indicators (Quadcode’s script library). This guide has no tested box: the Chaikin Volatility measures how wide the candles are, not which way the price goes, and there is no entry rule for it.
The Chaikin Volatility (VT) measures how fast the size of the candles is changing. It takes an exponential moving average of the high-low range over 10 candles and plots its relative change over the last 12 candles, as one line around a zero line in a panel under the price chart. A value of +0.5 means that the average candle range is 50% larger than it was 12 candles ago, and −0.3 means 30% smaller. It says nothing about direction. On 5-minute EUR/USD candles it ranged from −0.58 to +3.48, and was above zero on 45% of the 1,292 candles.
Quick answer
- What it plots: one line around a zero line in a panel under the price chart.
- Formula: VT = rate of change over 12 candles of EMA(high − low, 10): (EMA now − EMA 12 candles ago) ÷ EMA 12 candles ago, a fraction: 0.5 means +50%.
- Settings on the platform: five: Mov Avg Period (10), RoC Period (12), High (high), Low (low) and Moving Average (EMA).
- Reading: above zero the average candle range is growing, below zero it is shrinking. The line does not show direction.
- Where: the Volatility list of the Chart analysis panel; search for Chaikin.
- Not tested here: the usual readings of tops, bottoms and panic selling are descriptions, not entry rules; they are listed, not tested.
How do you add the Chaikin Volatility on IQ Option?
Set the chart
Choose the asset, the chart type and the candle size first: the indicator is calculated from the candles on the chart. The examples in this guide use 5-minute candles on EUR/USD. These steps use the web traderoom on a Practice balance, and the numbers in each screenshot match the numbers in the text. If you do not have an account yet, see how to register.
Step 1: Open Chart analysis
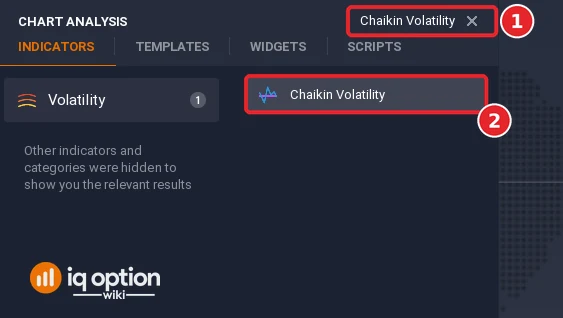
Click the indicators button (1), the wave icon in the chart toolbar at the bottom left of the chart. The Chart analysis panel opens with the tabs Indicators, Templates, Widgets and Scripts. Stay on Indicators.

Step 2: Find Chaikin Volatility
Type “Chaikin” in the Search for indicators box (1), or open the Volatility list, and click Chaikin Volatility (2).
Step 3: Check the settings
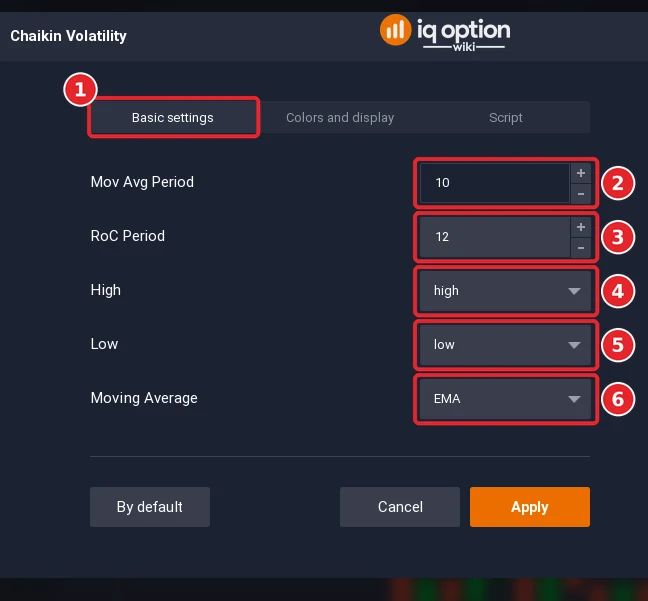
The dialog has three tabs: Basic settings (1), Colors and display and Script. The Mov Avg Period (2) opens at 10, the length of the moving average of the high-low range. The RoC Period (3) opens at 12, the number of candles over which the change of that average is measured. The High (4) opens at high, the price for the top of the range. The Low (5) opens at low, the price for the bottom of the range. The Moving Average (6) opens at EMA, the kind of moving average.
Step 4: Check the colours and click Apply
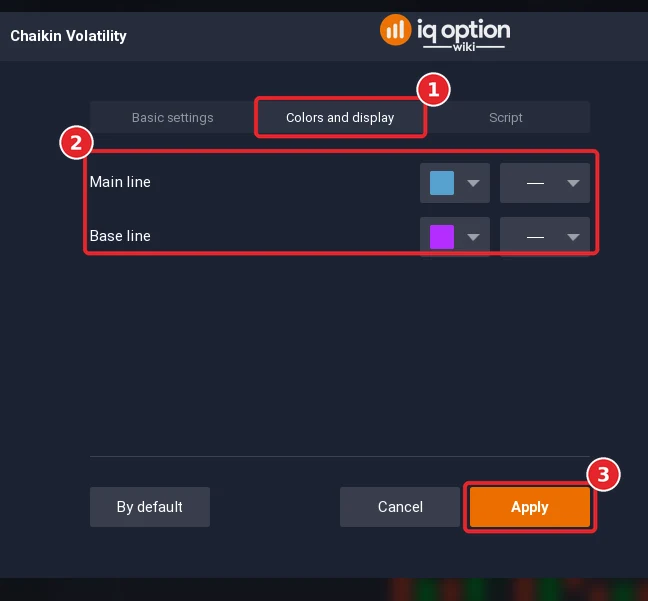
Open the Colors and display tab (1). The tab has two rows, the Main line (blue by default) and the Base line (the zero line, purple), each with a colour box and a line-style box. Both are in box 2. Click Apply (3).
Step 5: Read the panel
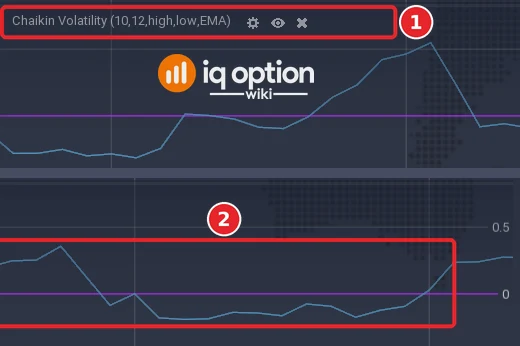
The indicator opens in a panel under the price chart. Its title, with all five settings in brackets, is at the top left of the panel (1); the blue line (2) moves around the purple zero line.
How is the Chaikin Volatility calculated?
The Quadcode source takes the difference between the high and the low of each candle, averages it with an exponential moving average over the Mov Avg Period (10), and then takes the rate of change of that average over the RoC Period (12): VT = (average now − average 12 candles ago) ÷ average 12 candles ago, a fraction (0.5 is +50%). The usual description has the same steps, with a 10-day moving average recommended by its author; the source lets you pick another kind of average in the dialog.
| Part | Default | What it does |
|---|---|---|
| Mov Avg Period | 10 | Length of the moving average of the high-low range |
| RoC Period | 12 | Number of candles over which the change of that average is measured |
| High and Low | high and low | The two prices whose difference is the range |
| Moving Average | EMA | The kind of moving average (an exponential one by default) |
The indicator is credited to Marc Chaikin.
How do you read the Chaikin Volatility?
A high value means that the range between the high and the low of the candles is wide and growing; a low value means that it is narrow or shrinking. How the line behaves around turning points is listed below, each as an observation, not as an entry rule:
| Market situation | The line |
|---|---|
| Price tops | Volatility increased over a short period |
| A growing bull market | Volatility decreasing over a long period |
| Price bottoms | Volatility decreasing over a long period (traders show little interest) |
| Panic selling at a bottom | Volatility increasing over a short period |
| Upward price movement | Low and decreasing volatility |
A slow rise of volatility can occur at the top of an uptrend before a reversal, volatility is higher in a downward move, and a short rise of volatility can be seen near the bottom of a downtrend. We did not test these statements; they are readings, not rules. The line only shows how wide the candles are becoming, never whether the price will go up or down.
What did it look like on 5-minute candles?
We replayed the library script on EUR/USD 5-minute candles recorded from the Practice traderoom: 1,093 candles from 29 September 2026 (01:55 UTC) to 2 October (20:55 UTC) and 241 from 4 October (21:00 UTC) to 5 October (17:00 UTC). With the defaults the line has a value from the 22nd candle of each stretch, 1,292 values in all.
- Range: from −0.58 to +3.48 (−58% to +348%); the highest value came in the second stretch, on the candle of 5 October that opened at 00:00 on the platform clock (03:00 UTC), when candle ranges jumped from about 3 pips to 12 and 22 pips after a quiet start of the week.
- Above zero: on 577 of the 1,292 candles (45%); the line crossed zero 136 times, about every 9.5 candles.
- Large moves: above +0.5 on 171 candles (13%) and below −0.3 on 143 (11%).
The Step 5 picture covers 05:27 to 11:16 on the platform clock. The line crossed zero 8 times in it. Its highest value, 0.55 at 07:05, came when the average range had grown from 2.7 pips twelve candles earlier to 4.2 pips; its lowest, −0.32 at 06:05, came when the average had fallen from 3.9 to 2.7 pips. In a second window of our recording, 10:44 to 16:33 (not pictured), the line crossed zero 18 times and reached 0.84 at 15:40, with the average range up from 3.1 to 5.7 pips, and −0.44 at 16:30, down from 4.9 to 2.7 pips. (The platform draws the value of a candle at the time the candle closes: the candle that opened at 07:00 sits at the 07:05 mark.)
Pros and Cons of the Chaikin Volatility
| Pros | Cons |
|---|---|
| Shows in one line whether the candles are getting wider or narrower, which helps to choose the expiry and the size of a stop. | It has no direction: the same rise can come with a rising or a falling price. |
| Simple formula, with a zero line and no levels to guess. | It is a change of an average, so it jumps when a quiet period ends or begins, such as the start of the trading week. |
| Can be used with any other indicator as a filter for quiet or busy markets. | It gives readings, not rules, so there is nothing here to test directly. |
Common mistakes
- Reading a rising line as bullish. A rising line means wider candles, in either direction.
- Comparing the value on different candle sizes. The line is a relative change of the range; a 1-minute and a 5-minute chart give different pictures.
- Trading the turning-point readings as rules. They are descriptions after the fact, and we did not test them.
- Forgetting quiet periods. After a quiet stretch, such as the start of the trading week, the line can show very large values for a short time.
Related guides
- Relative Volatility Index and Ulcer Index
- Keltner Channel and Bollinger Bands on IQ Option
- Best time to trade and slippage
- All indicator guides and all strategy guides
Frequently Asked Questions
Q: What is the Chaikin Volatility indicator?
A: An indicator that measures the relative change of a moving average of the high-low range of the candles. It shows whether the candles are getting wider or narrower. It is credited to Marc Chaikin.
Q: What settings does the Chaikin Volatility have on IQ Option?
A: Five: Mov Avg Period (10), RoC Period (12), High (high), Low (low) and Moving Average (EMA). The colours and line styles are on the Colors and display tab.
Q: Does it show the direction of the price?
A: No. It rises when the candles get wider, whether the price goes up or down.
Q: What does a value of +0.5 mean?
A: The 10-period average of the high-low range is 50% larger than it was 12 candles ago.
Q: Can I trade with the Chaikin Volatility alone?
A: It gives no entry. How the line behaves at tops and bottoms is described, and it is usually combined with other tools; we did not test those readings.
Q: Can I use it on binary options?
A: The platform draws it on any chart. It can help to see when the candles are quiet or wide, but whether a rule built on it works is something to test on the Practice balance.

