
Last updated: 8 October 2026. Every screenshot below was recorded on 8 October 2026 on an IQ Option Practice account registered in Brazil, on EUR/USD 5-minute candles; the Chart analysis picture in Step 1 was recorded on 5 October 2026. We placed no real-money trade. The settings come from the platform’s dialog and the calculation from the published source code of the platform’s built-in indicators (Quadcode’s script library). The tested box shows what the divergence rule did with the default periods and with the periods 4, 8 and 16 that it suggests, on EUR/USD candles recorded between 29 September and 5 October 2026; with so few signals it says nothing about what will happen next.
The Ultimate Oscillator (UO) measures buying pressure over three periods at once, 7, 14 and 28 candles, and combines them with weights 4, 2 and 1, so that the short period counts most but the long ones keep it from reacting to every wiggle. On IQ Option it opens in its own panel under the price chart as one line between 0 and 100, with lines at 70 and 30. The rule trades divergences: a bullish one with the UO below 30, a bearish one with the UO above 70, in each case after the oscillator breaks the high or the low of the divergence. With the default periods the UO reached 70 or 30 on only 3% of the 5-minute EUR/USD candles we replayed, and the rule gave a single signal.
Quick answer
- What it plots: one line from 0 to 100 in a panel under the price chart, with lines at 70 and 30.
- Formula: buying pressure BP = close − the lower of the low and the previous close; for each period, average = sum of BP ÷ sum of true range; UO = 100 × (4 × average7 + 2 × average14 + average28) ÷ 7.
- Settings on the platform: Period 1 7, Period 2 14, Period 3 28, Overbought 70 and Oversold 30. Shorter periods, 4, 8 and 16, are sometimes used for more signals.
- Reading: above 70 is overbought and below 30 oversold; the rule waits for a divergence before it trades.
- Where: the Momentum list of the Chart analysis panel; search for Ultimate.
- Tested: the divergence rule gave 1 signal with the default periods and 6 with the periods 4, 8 and 16 (5 of 6 won with a 15-minute trade); too few trades to judge. Break-even is 54.1% at an 85% payout, and a few days of one pair prove nothing.
How do you add the Ultimate Oscillator on IQ Option?
Set the chart
Choose the asset, the chart type and the candle size first: the indicator is calculated from the candles on the chart. The examples in this guide use 5-minute candles on EUR/USD. These steps use the web traderoom on a Practice balance, and the numbers in each screenshot match the numbers in the text. If you do not have an account yet, see how to register.
Step 1: Open Chart analysis
Click the indicators button (1), the wave icon in the chart toolbar at the bottom left of the chart. The Chart analysis panel opens with the tabs Indicators, Templates, Widgets and Scripts. Stay on Indicators.

Step 2: Find Ultimate Oscillator
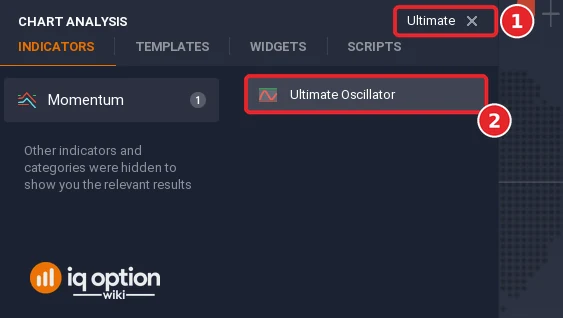
Type “Ultimate” in the Search for indicators box (1), or open the Momentum list, and click Ultimate Oscillator (2).
Step 3: Check the settings
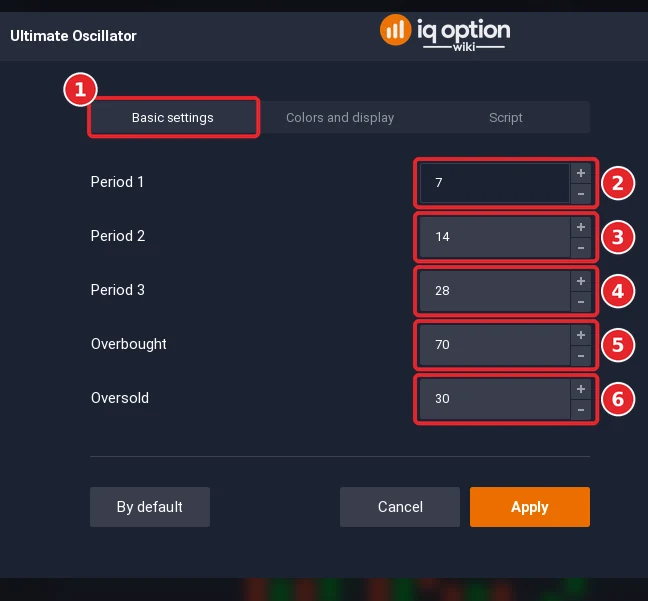
The dialog has the tabs Basic settings (1), Colors and display and Script. The Period 1 (2) opens at 7, the short period, weight 4. The Period 2 (3) opens at 14, the middle period, weight 2. The Period 3 (4) opens at 28, the long period, weight 1. The Overbought (5) opens at 70, the upper level line. The Oversold (6) opens at 30, the lower level line.
Step 4: Check the colours and click Apply
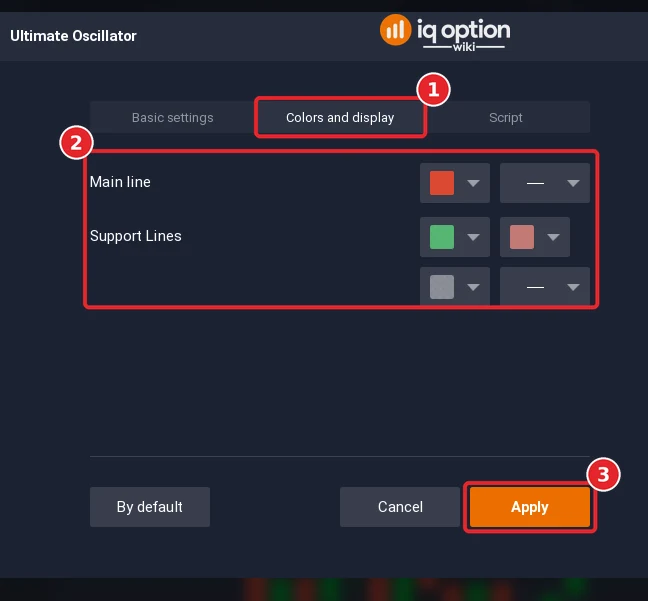
Open the Colors and display tab (1). The tab has two named rows: Main line, red by default, and Support Lines, which holds the colours of the 70 and 30 lines (green and red by default); each has colour boxes and a line-style box. Under them is a third row without a name, with a grey colour box and a line-style box; this guide does not change it. All the rows are in box 2. Click Apply (3).
Step 5: Read the panel
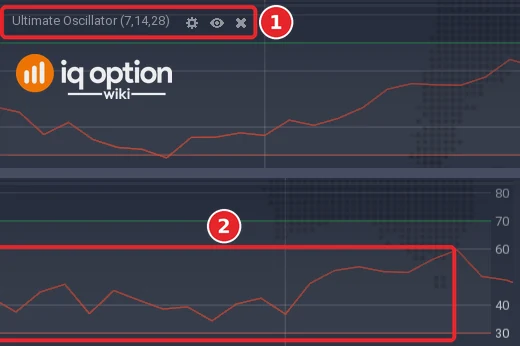
The panel under the price chart is titled Ultimate Oscillator (7,14,28) (1). The red line (2) moves between the two level lines, a green one at 70 and a red one at 30, and the scale at the right edge is marked 30, 40, 60, 70 and 80.
How is the Ultimate Oscillator calculated?
The Quadcode source works in three steps. First, the buying pressure of each candle: BP = close minus the lower of the candle’s low and the previous close. Second, for each of the three periods, the sum of BP over the period divided by the sum of the true range over the same period, which is a number between 0 and 1. Third, the three results are combined with weights 4, 2 and 1 for the shortest, the middle and the longest period, and scaled to 100: UO = 100 ÷ 7 × (4 × average of 7 + 2 × average of 14 + average of 28). The indicator is credited to Larry Williams, in 1976; many oscillators live in a single time frame and then form false divergences, which the three periods are meant to reduce.
| Part | Default | What it does |
|---|---|---|
| Period 1 | 7 | The short period, weight 4 |
| Period 2 | 14 | The middle period, weight 2 |
| Period 3 | 28 | The long period, weight 1 |
| Overbought and Oversold | 70 and 30 | The two level lines |
How do you read the Ultimate Oscillator?
The rule builds its signals on divergences. Long: a bullish divergence, where the oscillator makes a higher low while the price makes a lower low; the low of the oscillator must be below 30; then wait for the oscillator to rise beyond the high of the divergence. Short: a bearish divergence, where the oscillator makes a lower high while the price makes a higher high; the high of the oscillator must be above 70; then wait for the oscillator to fall beneath the low of the divergence, which is read as a confirmation of a coming reversal.
Some securities and stocks may not show overbought and oversold readings with the default settings, and periods of 4, 8 and 16 make the oscillator more sensitive and give more signals; for very volatile assets the opposite is suggested, longer periods. The UO is said to reduce false divergences, which we did not test.
What did it look like on 5-minute candles?
We replayed the library script on EUR/USD 5-minute candles recorded from the Practice traderoom: 1,093 candles from 29 September 2026 (01:55 UTC) to 2 October (20:55 UTC) and 241 from 4 October (21:00 UTC) to 5 October (17:00 UTC). With the default periods the line has a value from the 29th candle of each stretch, 1,278 values in all.
- Default periods (7, 14, 28): the line stayed between 19.2 and 77.5; it was at or above 70 on 11 candles and at or below 30 on 26, together 3% of the candles.
- The shorter periods (4, 8, 16): between 10.5 and 82.3, at or above 70 on 67 candles and at or below 30 on 100, together 13%.
Two stills of the platform, window A (the Step 5 picture) and window B (not pictured), agree with the replay (read off the panel at 131 points, the line differed from the replay by 0.1 points at the median in window A and 0.6 in window B): the line only grazes the 30 line and never reaches the 70 line. In window A, 29 September from 05:56 to 11:45 on the platform clock, the oscillator touches 30 at 06:40 (29.1), climbs to 69.3 at 09:05, just under the 70 line, and ends near 49. In window B, from 11:17 to 17:02, it falls to 29.9 at 14:00, rises to 61.9 at 15:15 and ends near 48. These are the extremes of the replay as well, which is at or under a level only at 06:40 and 14:00 in the two windows, and so the rule below had little to work with in them. (The platform draws the value of a candle at the time the candle closes: the candle that opened at 08:00 sits at the 08:05 mark.)
The divergence rule, tested
We wrote the rule as exact conditions on closed candles. A pivot low is a candle whose low is lower than the lows of the three candles on each side, and a pivot high is the mirror. Long: two pivot lows at most 40 candles apart, the second price low lower than the first and the second oscillator value higher (bullish divergence), the lower of the two oscillator values below 30; the signal comes on the first candle, within 30 candles after the second pivot is confirmed, where the oscillator closes above its highest value between the two pivots. Short: the mirror, with an oscillator value above 70. The option opens at the close of the signal candle. No expiry is given, so the box shows five minutes and fifteen minutes on 5-minute candles, and five minutes on 1-minute candles.
Tested on IQ Option: the Ultimate Oscillator divergence rule, EUR/USD candles of 29 September to 5 October 2026
| Asset and candles | EUR/USD binary (regular, not OTC): 1,334 five-minute candles (2026-09-29 01:55 to 2026-10-02 20:55 UTC and 2026-10-04 21:00 to 2026-10-05 17:00 UTC); 1,505 one-minute candles (2026-10-02 18:23 to 2026-10-02 20:59 UTC and 2026-10-04 21:01 to 2026-10-05 19:28 UTC). The candles were recorded from IQ Option’s Practice traderoom. The replay places no orders; it only scores the rule on those closed candles, at an 85% payout. |
|---|---|
| Rule tested | The divergence rule on closed candles (pivots of three candles on each side, at most 40 candles apart, the signal within 30 candles after the second pivot is confirmed): bullish divergence with the oscillator low under 30 and the oscillator then closing above its highest value between the two pivots is Higher; bearish divergence with the oscillator high over 70 and the oscillator then closing below its lowest value between the pivots is Lower. The option opens at the close of the signal candle. The box shows the default periods 7, 14 and 28 and the periods 4, 8 and 16, with 5-minute trades on 5-minute candles (and 15 minutes for the second) and 5-minute trades on 1-minute candles. |
| Signals | Defaults 7/14/28: divergence plus break, 5-minute, 1 candle: 1 signals (1 Higher, 0 Lower) Settings 4/8/16 (the usual setting), 5-minute, 1 candle: 6 signals (3 Higher, 3 Lower) Settings 4/8/16, 5-minute, 3 candles: 6 signals (3 Higher, 3 Lower) Defaults, 1-minute, 5 candles: 2 signals (2 Higher, 0 Lower) Settings 4/8/16, 1-minute, 5 candles: 5 signals (3 Higher, 2 Lower) |
| Outcomes | Defaults 7/14/28: divergence plus break, 5-minute, 1 candle: 1 won, 0 lost, 0 tied; 100.0% of the 1 decided trades won; net +$0.85 per $1 staked at 85% (+$0.91 at 91%) Settings 4/8/16 (the usual setting), 5-minute, 1 candle: 3 won, 3 lost, 0 tied; 50.0% of the 6 decided trades won; net −$0.07 per $1 staked at 85% (−$0.04 at 91%) Settings 4/8/16, 5-minute, 3 candles: 5 won, 1 lost, 0 tied; 83.3% of the 6 decided trades won; net +$0.54 per $1 staked at 85% (+$0.59 at 91%) Defaults, 1-minute, 5 candles: 0 won, 1 lost, 1 tied; 0.0% of the 1 decided trades won; net −$0.50 per $1 staked at 85% (−$0.50 at 91%) Settings 4/8/16, 1-minute, 5 candles: 2 won, 3 lost, 0 tied; 40.0% of the 5 decided trades won; net −$0.26 per $1 staked at 85% (−$0.24 at 91%) |
| Break-even | At an 85% payout a trade needs to win more than 54.1% of its decided trades to break even (1 ÷ 1.85); at 91%, more than 52.4% (1 ÷ 1.91). |
A replay is only a look back at candles recorded on the dates above: it placed no real orders, covers about four and a half days of one pair, and counts overlapping trades as if they were independent. A short test proves nothing about the future, and no profit and no win rate is promised here. IQ Option’s own blog on backtesting says that most strategies need dozens, and often hundreds, of trades before a result means anything.
With the default periods the rule gave a single signal, a Higher trade that won. With the periods 4, 8 and 16 it gave 6 signals, 3 Higher and 3 Lower: with a 5-minute trade 3 won and 3 lost, with a 15-minute trade 5 won and 1 lost (83.3%, but with a 95% interval of 44% to 97%). On 1-minute candles with a 5-minute trade the default periods gave 2 signals (1 lost and 1 tied) and the periods 4, 8 and 16 gave 5 (2 won and 3 lost). Six trades or fewer say nothing about the rule, which fits the rule: the divergence is rare, and the longer the periods the rarer it is.
Pros and Cons of the Ultimate Oscillator
| Pros | Cons |
|---|---|
| Three periods in one line, so it reacts less to a single wiggle than a one-period oscillator. | With the default periods it rarely reaches 70 or 30: 3% of the candles in our recording. |
| Bounded between 0 and 100, with level lines, so overbought and oversold are easy to see. | The divergence rule needs two pivots, an extreme and a break, so it gives very few signals. |
| The periods can be shortened for more signals. | More signals mean a less smooth line; with 4, 8 and 16 the rule still gave only six signals. |
Common mistakes
- Waiting for 70 or 30 on the default periods. They were reached on 3% of the candles; on some assets the line does not reach the levels at all.
- Trading a divergence before the break. The rule waits for the oscillator to break the high or the low of the divergence.
- Judging the rule by a handful of trades. The rule gave 1 to 6 signals in our recording.
- Changing the periods without a test. A shorter set gives more signals and more noise.
Related guides
- Classic and hidden divergences and RSI on IQ Option
- Stochastic on IQ Option and Williams %R on IQ Option
- Overbought and oversold markets and three popular oscillators
- All indicator guides and all strategy guides
Frequently Asked Questions
Q: What is the Ultimate Oscillator?
A: A momentum oscillator that combines buying pressure over three periods, 7, 14 and 28 candles by default, with weights 4, 2 and 1, into one line from 0 to 100. It is credited to Larry Williams.
Q: What settings does the Ultimate Oscillator have on IQ Option?
A: Period 1 7, Period 2 14, Period 3 28, Overbought 70 and Oversold 30. The Colors and display tab has a colour and a line style for the line and for the two level lines.
Q: What do 70 and 30 mean?
A: Above 70 is the overbought area and below 30 the oversold area. With the default periods the line reached them on only 3% of our 5-minute candles.
Q: Which signals does the Ultimate Oscillator rule use?
A: Divergences: a bullish one with the oscillator below 30, a bearish one with it above 70, each confirmed by a break of the high or the low of the divergence. The results are in the tested box.
Q: Which periods should I use?
A: The platform opens at 7, 14 and 28. Shorter periods, 4, 8 and 16, give more signals, and longer periods suit very volatile assets.
Q: Can I use the Ultimate Oscillator on binary options?
A: The platform draws it on any chart. Whether a rule works is something to test on the Practice balance with the expiry you plan to use.

