
Last updated: 8 October 2026. Every screenshot below was recorded on 8 October 2026 on an IQ Option Practice account registered in Brazil, on EUR/USD 5-minute candles; the Chart analysis picture in Step 1 was recorded on 5 October 2026. We placed no real-money trade. The settings come from the platform’s dialog and the calculation from the published source code of the platform’s built-in indicators (Quadcode’s script library). The tested box shows what the rule, with and without its next-candle confirmation, did on EUR/USD 5-minute candles recorded between 29 September and 5 October 2026; it says nothing about what will happen next.
The Schaff Trend Cycle (STC) takes a MACD line, the difference between two exponential moving averages, and runs it twice through a stochastic formula with smoothing, so that the result is a line between 0 and 100. On IQ Option it opens in its own panel under the price chart with lines at 25 and 75. The rule buys when the line rises above 25 and sells when it falls below 75, and waits for the next candle to confirm. The line sits close to 0 or 100 for much of the time: on the 5-minute EUR/USD candles we replayed it was at or above 99 or at or below 1 on 51% of the candles, and above 75 or below 25 on 88%.
Quick answer
- What it plots: one line from 0 to 100 in a panel under the price chart, with lines at 75, 50 and 25 and a coloured fill beyond 75 and 25.
- Formula: MACD = EMA(23) − EMA(50); stochastic of the MACD over 10 candles, smoothed with a factor of 0.5; a second stochastic and the same smoothing give the STC.
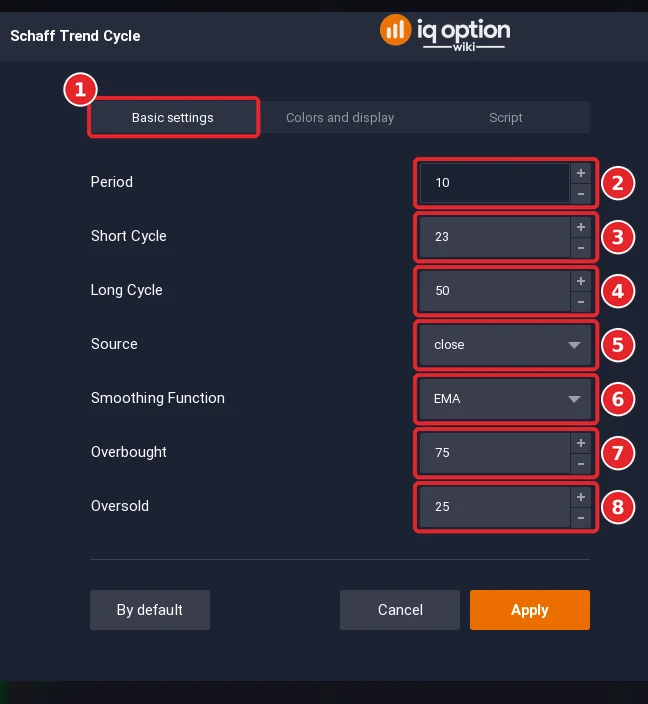
- Settings on the platform: the Period (10), the Short Cycle (23), the Long Cycle (50), the Source (close), the Smoothing Function (EMA), Overbought (75) and Oversold (25).
- Reading: above 75 is the overbought area and below 25 the oversold area; the rule buys on a rise through 25 and sells on a fall through 75.
- Where: the Momentum list of the Chart analysis panel; search for Schaff.
- Tested: the 25/75 rule gave 80 signals and won 42.5% of the decided trades with a 5-minute trade and 54.4% with a 15-minute trade; with its next-candle confirmation it gave 34 signals and 50.0% and 55.9%. Break-even is 54.1% at an 85% payout, and a few days of one pair prove nothing.
How do you add the Schaff Trend Cycle on IQ Option?
Set the chart
Choose the asset, the chart type and the candle size first: the indicator is calculated from the candles on the chart. The examples in this guide use 5-minute candles on EUR/USD. These steps use the web traderoom on a Practice balance, and the numbers in each screenshot match the numbers in the text. If you do not have an account yet, see how to register.
Step 1: Open Chart analysis
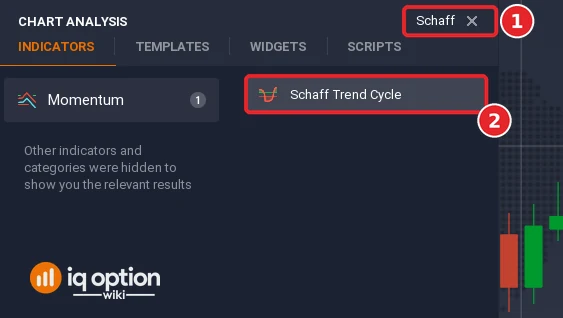
Click the indicators button (1), the wave icon in the chart toolbar at the bottom left of the chart. The Chart analysis panel opens with the tabs Indicators, Templates, Widgets and Scripts. Stay on Indicators.

Step 2: Find Schaff Trend Cycle
Type “Schaff” in the Search for indicators box (1), or open the Momentum list, and click Schaff Trend Cycle (2).
Step 3: Check the settings
The dialog has the tabs Basic settings (1), Colors and display and Script. The Period (2) opens at 10, the length of the two stochastic windows. The Short Cycle (3) opens at 23, the period of the fast moving average of the MACD. The Long Cycle (4) opens at 50, the period of the slow moving average of the MACD. The Source (5) opens at close, the price used. The Smoothing Function (6) opens at EMA, the kind of moving average used for the two cycles. The Overbought (7) opens at 75, the upper level line. The Oversold (8) opens at 25, the lower level line.
Step 4: Check the colours and click Apply
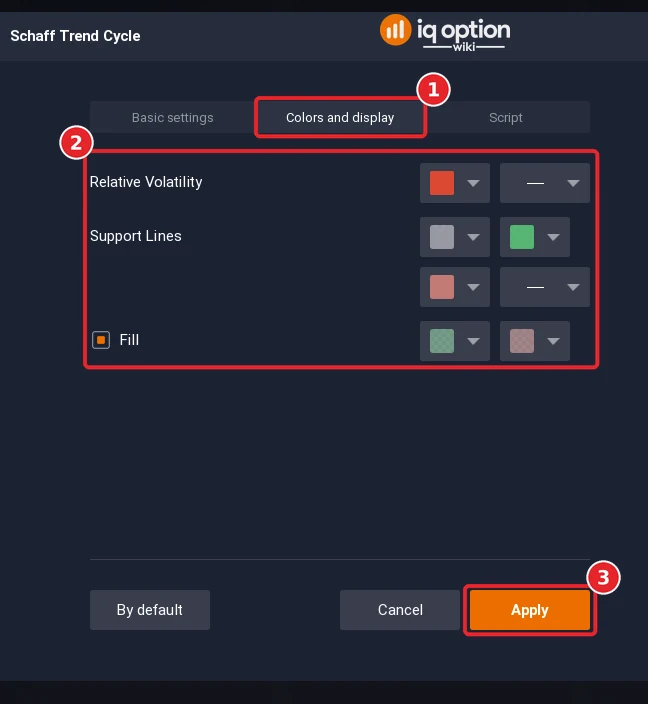
Open the Colors and display tab (1). The tab has three rows. The first is called Relative Volatility, the name that the platform gives to the group that holds the colour of the STC line: red by default, with a colour box and a line-style box. Support Lines has three colour boxes, grey, green and pink by default for the 50, 75 and 25 lines, and a line-style box. Fill has a checkbox and two colour boxes, green for the area above 75 and red for the area below 25. All the rows are in box 2. Click Apply (3).
Step 5: Read the panel
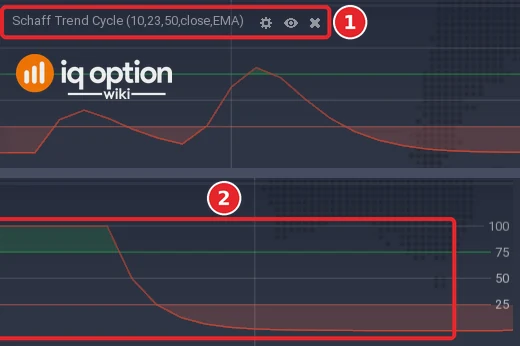
The line is drawn in its own panel under the price chart. The title bar of the panel reads Schaff Trend Cycle (10,23,50,close,EMA), the period, the two cycles, the source and the smoothing function, followed by the settings, eye and close icons (1). The scale at the right edge shows 100, 75, 50 and 25; a green line marks 75, a grey line 50 and a red line 25, with a green fill above 75 and a red fill below 25. The STC is the red line that moves (2).
How is the Schaff Trend Cycle calculated?
The Quadcode source builds the line in four steps. First it takes a MACD: the difference between an exponential moving average over the Short Cycle (23) and one over the Long Cycle (50). Second, it applies a stochastic formula to that MACD over the Period (10): where the MACD lies between its lowest and highest value of the last 10 candles, from 0 to 100. Third, it smooths that value, moving half of the way towards each new reading. Fourth, it applies the stochastic formula and the same smoothing a second time, and the result is the STC. The indicator is credited to Doug Schaff, in 1999; it rests on the assumption that all trends move in cycles.
| Part | Default | What it does |
|---|---|---|
| Period | 10 | Length of the two stochastic windows |
| Short Cycle | 23 | Period of the fast moving average of the MACD |
| Long Cycle | 50 | Period of the slow moving average of the MACD |
| Source | close | The price used |
| Smoothing Function | EMA | The kind of moving average used for the two cycles |
| Overbought and Oversold | 75 and 25 | The two level lines; the line at 50 is fixed |
Because the stochastic formula is applied to the MACD, the line is always between 0 and 100, and it goes close to 0 or 100 whenever the MACD stays at its lowest or highest value of the last 10 candles for long enough.
How do you read the Schaff Trend Cycle?
The two outer lines are the important ones. When the line passes 25 on its way up, an uptrend is expected; when it falls below 75, a downtrend is coming. Between 25 and 75 the trend is developing. When the line runs flat at the top or the bottom, the instrument is overbought (above 75) or oversold (below 25), and the longer the flat line, the more likely a trend change; a trade is closed when the line turns into a straight line. The STC is compared with the MACD and is said to signal earlier, which we did not test.
The same guide asks for a confirmation before each entry: for a short trade, wait until the next candle develops in the same direction, or use another indicator; for a long trade the same after the rise above 25. It also warns that the line can stay in the overbought and oversold areas for a large part of the time, and that it can give false signals in ranging markets.
What did it look like on 5-minute candles?
We replayed the library script on EUR/USD 5-minute candles recorded from the Practice traderoom: 1,093 candles from 29 September 2026 (01:55 UTC) to 2 October (20:55 UTC) and 241 from 4 October (21:00 UTC) to 5 October (17:00 UTC). The first 100 candles of each stretch are skipped, while the moving averages settle, which leaves 1,134 candles.
- Time in the zones: above 75 on 502 candles (44%) and below 25 on 494 (44%); at or above 99 on 307 candles (27%) and at or below 1 on 277 (24%).
- Crossings: the line rose through 25 40 times and fell through 75 40 times, together about one every 14 candles.
Two stills of the platform, window A (the Step 5 picture shows its two ends) and window B (not pictured), agree with the replay. The replay starts its averages at 01:55 UTC on 29 September, and until 07:15 on the platform clock it has not settled, so the first 25 candles of window A are left out of the check: read off the chart at 106 points of the two windows, the line differed from the replay of the script by 0.5 points on average and by 4.9 at most, on a scale of 0 to 100. In window A, 29 September from 05:03 to 10:51 on the platform clock, the line rises through 75 at 07:15, is at 99.0 or more from 07:35 until 09:30, and then halves with every candle: 50.0 at 09:35, 25.0 at 09:40, 12.5 at 09:45, until it ends at 0.0 at 10:50. In window B, from 10:20 to 16:09, it is at 0.0 until 10:50, jumps to 47.3 at 11:05, dips to 16.0 at 11:25, makes a peak of 94.8 at 11:45 and is under 25 again at 12:05; after a second jump to 50.0 at 13:00 it peaks at 87.5 at 13:10 and is under 25 at 13:30, and from 13:55 to 14:55 it stays at or under 1. At 15:00 it jumps to 50.0, at 15:05 it reaches 75.0, and from 15:50 it is at 100.0 until the window ends at 16:05. (A point is drawn at the close of its candle: the value of the candle that opened at 09:30 sits at the 09:35 mark.)
The rule, tested
We wrote the rule as an exact condition on closed candles: Higher on the candle where the STC rises above 25, and Lower on the candle where it falls below 75, with the option opened at the close of that candle. The confirmed version waits one candle: the signal comes on the close of the next candle, and only if that candle is bullish (Higher) or bearish (Lower). No expiry is given, so the box shows five minutes and fifteen minutes.
Tested on IQ Option: the Schaff Trend Cycle, EUR/USD 5-minute candles of 29 September to 5 October 2026
| Asset and candles | EUR/USD binary (regular, not OTC): 1,334 five-minute candles (2026-09-29 01:55 to 2026-10-02 20:55 UTC and 2026-10-04 21:00 to 2026-10-05 17:00 UTC). The candles were recorded from IQ Option’s Practice traderoom. The replay places no orders; it only scores the rule on those closed candles, at an 85% payout. |
|---|---|
| Rule tested | The rule on closed candles, the option opening at the close of the signal candle: Higher on the candle where the STC rises above 25, Lower on the candle where it falls below 75. With the confirmation: the signal comes on the close of the next candle, and only if that candle is bullish (Higher) or bearish (Lower). The first 100 candles of each stretch are skipped while the averages settle. No expiry is given, so the box shows 5 and 15 minutes on 5-minute candles. |
| Signals | STC crosses 25 up / 75 down, 5-minute, 1 candle: 80 signals (40 Higher, 40 Lower) STC with next-candle confirmation, 5-minute, 1 candle: 34 signals (14 Higher, 20 Lower) STC cross, 5-minute, 3 candles: 80 signals (40 Higher, 40 Lower) STC with confirmation, 5-minute, 3 candles: 34 signals (14 Higher, 20 Lower) |
| Outcomes | STC crosses 25 up / 75 down, 5-minute, 1 candle: 34 won, 46 lost, 0 tied; 42.5% of the 80 decided trades won; net −$0.21 per $1 staked at 85% (−$0.19 at 91%) STC with next-candle confirmation, 5-minute, 1 candle: 17 won, 17 lost, 0 tied; 50.0% of the 34 decided trades won; net −$0.07 per $1 staked at 85% (−$0.04 at 91%) STC cross, 5-minute, 3 candles: 43 won, 36 lost, 1 tied; 54.4% of the 79 decided trades won; net +$0.01 per $1 staked at 85% (+$0.04 at 91%) STC with confirmation, 5-minute, 3 candles: 19 won, 15 lost, 0 tied; 55.9% of the 34 decided trades won; net +$0.03 per $1 staked at 85% (+$0.07 at 91%) |
| Break-even | At an 85% payout a trade needs to win more than 54.1% of its decided trades to break even (1 ÷ 1.85); at 91%, more than 52.4% (1 ÷ 1.91). |
A replay is only a look back at candles recorded on the dates above: it placed no real orders, covers about four and a half days of one pair, and counts overlapping trades as if they were independent. A short test proves nothing about the future, and no profit and no win rate is promised here. IQ Option’s own blog on backtesting says that most strategies need dozens, and often hundreds, of trades before a result means anything.
With a trade of one candle (5 minutes) the plain rule gave 80 signals and won 34 of the 80 decided trades (42.5%), and the rule with the confirmation gave 34 signals and won 17 (50.0%). With a trade of three candles (15 minutes) the plain rule won 43 of the 79 decided trades (54.4%, one tie) and the confirmed rule 19 of 34 (55.9%). Break-even is 54.1% at an 85% payout, so the two 15-minute results sit on it, and their 95% intervals (43% to 65% and 39% to 71%) are wide enough to include 50%; the two 5-minute results are below it.
Pros and Cons of the Schaff Trend Cycle
| Pros | Cons |
|---|---|
| One bounded line with two clear levels, 25 and 75. | The line spends most of its time beyond the levels, so a level alone says little. |
| The double smoothing and the two stochastic steps turn the MACD into a fast-moving line. | More inputs than most oscillators: seven settings in the dialog. |
| The rule asks for a confirmation before an entry, which removes more than half of the signals (80 became 34 in our replay). | It can give false signals in a range, and the confirmation does not remove them. |
Common mistakes
- Reading 75 or 25 as a reversal. The line was beyond them on 88% of the candles in our recording.
- Ignoring the warm-up. The two moving averages and the stochastic windows need about 100 candles to settle.
- Trading it in a range. It can give false signals there.
- Taking a good-looking result as proof. The four results run from 42.5% to 55.9% on 34 to 80 signals, which is inside the margin of a few dozen trades.
Related guides
- MACD on IQ Option and Stochastic on IQ Option
- Double Stochastic and Know Sure Thing
- Overbought and oversold markets and leading and lagging indicators
- All indicator guides and all strategy guides
Frequently Asked Questions
Q: What is the Schaff Trend Cycle?
A: An oscillator that runs a MACD through two smoothed stochastic steps, so that it moves between 0 and 100 and turns faster than the MACD itself. It is credited to Doug Schaff.
Q: What settings does the Schaff Trend Cycle have on IQ Option?
A: Seven: the Period (10), the Short Cycle (23), the Long Cycle (50), the Source (close), the Smoothing Function (EMA), Overbought (75) and Oversold (25); the colours of the line, of the 50, 75 and 25 lines and of the fill can be changed on the Colors and display tab.
Q: What do the 25 and 75 lines mean?
A: Below 25 is the oversold area and above 75 the overbought area. The rule buys when the line rises through 25 and sells when it falls through 75.
Q: Does the Schaff Trend Cycle signal earlier than the MACD?
A: It is said to. We did not test it.
Q: Does it work on 5-minute charts?
A: It is said to work on any market and any time frame, from intraday to monthly. In our replay on 5-minute EUR/USD candles the 25/75 rule was close to the break-even rate; the results are in the tested box.
Q: Can I use it on binary options?
A: The platform draws it on any chart. Whether a rule works is something to test on the Practice balance with the expiry you plan to use.

