
Last updated: 8 October 2026. Every screenshot below was recorded on 8 October 2026 on an IQ Option Practice account registered in Brazil, on EUR/USD 5-minute candles; the Chart analysis picture in Step 1 was recorded on 5 October 2026. We placed no real-money trade. The settings come from the platform’s dialog and the calculation from the published source code of the platform’s built-in indicators (Quadcode’s script library). The tested box shows what the rule, a close through the EMA 100 together with a Special K cross of zero, did on EUR/USD 5-minute candles recorded between 29 September and 5 October 2026; it says nothing about what will happen next.
Special K is Martin Pring’s momentum indicator. It adds up twelve smoothed rates of change, four short-term, four intermediate and four long-term, each given a weight from 1 to 4, and the platform draws the sum in a panel under the price chart as a line called K, with a second line, MA, that smooths K further. The panel draws no zero line and no scale, but the crosshair shows the value under it at the right edge; K above zero means that the weighted sum of the recent price changes is positive, below zero that it is negative. It needs a long history: in the default Daily mode its longest lookback is 530 candles plus a 195-candle average, so on 5-minute candles it is complete only after about 725 candles, roughly two and a half days of EUR/USD. On the candles we recorded, K was below zero for all 368 candles after that point.
Quick answer
- What it plots: two lines in a panel under the price chart: K, the weighted sum of twelve smoothed rates of change, and MA, a smoothed copy of K.
- Formula: K = the sum of twelve terms, each a weight (1 to 4) times a moving average of a rate of change; four terms each for short, intermediate and long cycles.
- Settings on the platform: Mode (Daily by default, or Weekly), Period 1 and Period 2 (both 100).
- Zero: K above zero means a positive weighted sum, below zero a negative one. The panel draws no zero line; the crosshair shows the value (−0.0347 on the still of 29 September at 09:50).
- Where: the Momentum list of the Chart analysis panel; search for Special K.
- Tested: the Daily mode gave no signal after its warm-up; the Weekly mode gave 18 signals, and the 3-candle trades won 12 of 18 (66.7%) while the 1-candle trades won 7 of 16 decided (43.8%). Break-even is 54.1% at an 85% payout, and a few days of one pair prove nothing.
How do you add the Special K on IQ Option?
Set the chart
Choose the asset, the chart type and the candle size first: the indicator is calculated from the candles on the chart. The examples in this guide use 5-minute candles on EUR/USD. These steps use the web traderoom on a Practice balance, and the numbers in each screenshot match the numbers in the text. If you do not have an account yet, see how to register.
Step 1: Open Chart analysis
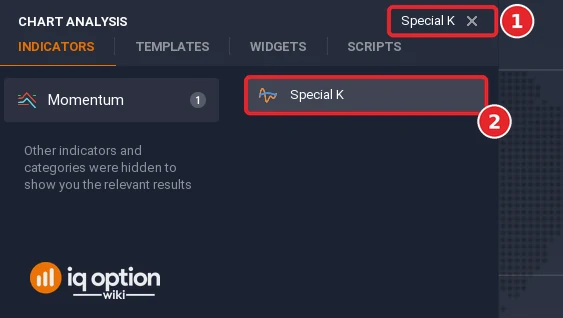
Click the indicators button (1), the wave icon in the chart toolbar at the bottom left of the chart. The Chart analysis panel opens with the tabs Indicators, Templates, Widgets and Scripts. Stay on Indicators.

Step 2: Find Special K
Type “Special K” in the Search for indicators box (1), or open the Momentum list, and click Special K (2).
Step 3: Check the settings
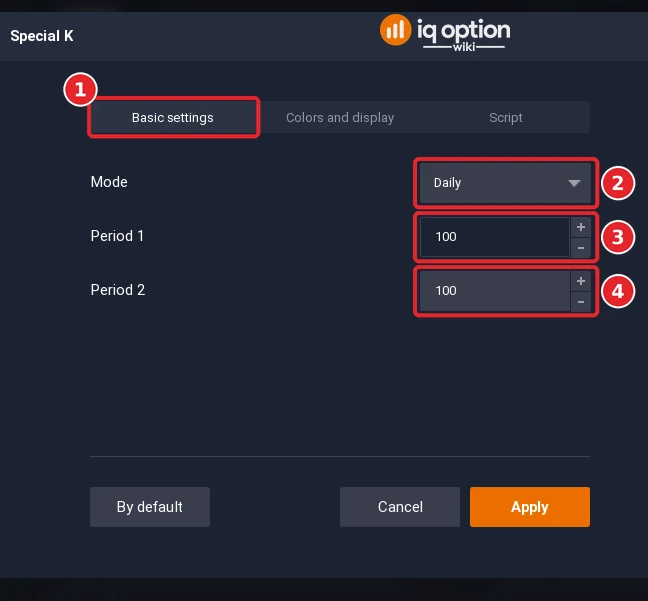
The dialog has the tabs Basic settings (1), Colors and display and Script. The Mode (2) opens at Daily, a drop-down that switches between the Daily and the Weekly set of periods. The Period 1 (3) opens at 100, the first smoothing of the MA line. The Period 2 (4) opens at 100, the second smoothing of the MA line.
Step 4: Check the colours and click Apply
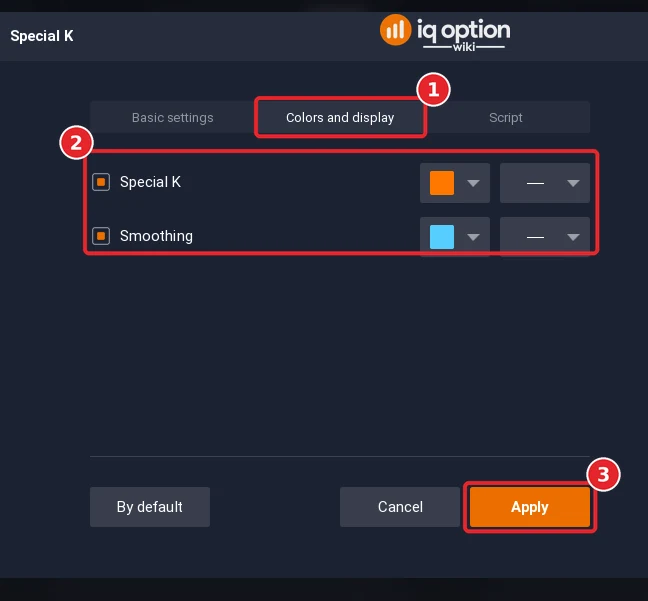
Open the Colors and display tab (1). The tab has two rows, Special K and Smoothing, each with a colour box and a line-style box: orange for the K line and light blue for the MA line by default. Click Apply (3).
Step 5: Read the panel
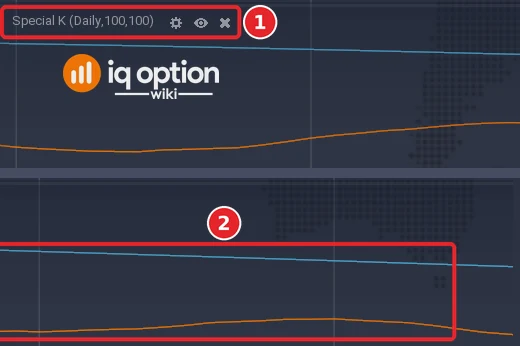
The panel under the price chart is titled Special K (Daily,100,100) (1). It holds two lines (2): K in orange and its smoothed copy MA in light blue. In this window K lies under MA and both move slowly.
How is the Special K calculated?
The Quadcode source builds K from three groups of four terms. Each term takes the change of the close over a number of candles as a fraction of the earlier close (the rate of change, ROC), smooths it with a moving average and multiplies the result by a weight of 1, 2, 3 or 4; the weights grow with the length of the rate of change inside each group. K is the sum of the three groups, and a group whose terms do not have a value yet counts as zero. The table lists each term as rate-of-change period / average period × weight, in candles.
| Group | Daily mode (default): simple moving averages | Weekly mode: exponential moving averages |
|---|---|---|
| Short-term | 10/10 × 1, 15/10 × 2, 20/10 × 3, 30/50 × 4 | 4/4 × 1, 5/5 × 2, 6/6 × 3, 8/8 × 4 |
| Intermediate | 50/50 × 1, 65/65 × 2, 75/75 × 3, 100/100 × 4 | 10/10 × 1, 13/13 × 2, 15/15 × 3, 20/20 × 4 |
| Long-term | 195/130 × 1, 265/130 × 2, 390/130 × 3, 530/195 × 4 | 39/26 × 1, 52/26 × 2, 78/26 × 3, 104/39 × 4 |
The two modes are two sets of periods. The dialog calls them Daily and Weekly, but the periods are counted in candles, so on a 5-minute chart the Daily mode looks back 530 candles, about 44 hours, in its longest term. The method is Martin Pring’s, and the source’s comments refer to the user’s guide of a MetaStock Special K add-on.
The second line, MA, is not part of the sum: it is a simple moving average of a simple moving average of K, with Period 1 and Period 2 (both 100 by default). It starts only after K is complete, so with the defaults it needs about 200 more candles.
How do you read the two lines?
The Special K is read against zero, although the panel draws no zero line. K above zero means that the weighted sum of the smoothed changes is positive, which is read as a bullish market; K below zero means that the sum is negative, a bearish market. A cross of the zero line is the event the rule waits for. MA is the slower line: a K that stays on one side of MA for a long time is moving in one direction relative to its own long average.
Every term is a moving average of a change over many candles, so K turns after the price does. The peaks and troughs of the price come a little earlier than those of the indicator. It is a lagging indicator and cannot say what the next candle will do.
What did it look like on 5-minute candles?
We replayed the library script on EUR/USD 5-minute candles recorded from the Practice traderoom: 1,093 candles in one stretch (29 September 2026 from 01:55 UTC to 2 October 20:55 UTC) and 241 in another (4 October 21:00 UTC to 5 October 17:00 UTC). The script starts from the first candle of a stretch, so the line is complete only after its longest lookback.
- Daily mode (default): K is complete from the 726th candle, 1 October at 11:20 on the platform clock (14:20 UTC). From then to the end of the stretch, 368 candles, it stayed below zero, between −0.111 and −0.040, while EUR/USD fell from 1.1286 to 1.1257. It did not cross zero once.
- Weekly mode: K is complete from the 144th candle. In the first stretch it was above zero in 376 of the 950 candles after that and crossed zero 23 times, about once every 41 candles; in the second stretch it crossed zero 6 times in the 98 candles after its warm-up.
Two stills of the platform, window A (the Step 5 picture) and window B (not pictured), show the same picture. In window A, 29 September from 06:46 to 12:35 on the platform clock, K runs in a shallow wave under the MA line, with a hump around 09:15 and a low around 10:40, while MA slopes slowly down. In window B, from 12:04 to 17:53, K falls away from MA to a sharp low at about 15:00, climbs back to within a short distance of MA around 16:25 and falls again. K stays under MA in both windows. On the hover still the crosshair at 09:50 on 29 September reads −0.0347 on the value axis of the panel, so K is negative there. We cannot compare these windows with the replay, because the Daily mode needs about 725 candles, the platform draws K from the earlier candles it has loaded, and our recording starts on 29 September at 01:55 UTC.
The EMA 100 rule
The rule adds an exponential moving average with a period of 100 to the chart and waits for two things at the same time. For a Higher (long) trade, the price crosses above the EMA 100 and K rises above its zero line; for a Lower (short) trade, the price crosses below the EMA 100 and K falls below zero. We wrote that as a rule on closed candles: a candle closes above (or below) the EMA 100 after a candle that did not, and K crosses zero in the same direction on the same candle or at most three candles apart; the signal is the later of the two events, and the option opens at the close of that candle.
Tested on IQ Option: the EMA 100 and Special K rule, EUR/USD 5-minute candles of 29 September to 5 October 2026
| Asset and candles | EUR/USD binary (regular, not OTC): 1,093 five-minute candles (2026-09-29 01:55 to 2026-10-02 20:55 UTC). The candles were recorded from IQ Option’s Practice traderoom. The replay places no orders; it only scores the rule on those closed candles, at an 85% payout. |
|---|---|
| Rule tested | The rule on closed candles: Higher when a candle closes above the EMA 100 after a candle that did not and the Special K crosses above zero on the same candle or within three candles; Lower is the mirror. The signal is the later of the two events, and the option opens at its close. Daily mode is the dialog default; Weekly mode is the other set of periods. The EMA 100 runs over the whole recording. |
| Signals | Daily mode (dialog default), 5-minute, 1 candle: no signal Weekly mode, 5-minute, 1 candle: 18 signals (10 Higher, 8 Lower) Weekly mode, 5-minute, 3 candles: 18 signals (10 Higher, 8 Lower) |
| Outcomes | Daily mode (dialog default), 5-minute, 1 candle: no trade Weekly mode, 5-minute, 1 candle: 7 won, 9 lost, 2 tied; 43.8% of the 16 decided trades won; net −$0.17 per $1 staked at 85% (−$0.15 at 91%) Weekly mode, 5-minute, 3 candles: 12 won, 6 lost, 0 tied; 66.7% of the 18 decided trades won; net +$0.23 per $1 staked at 85% (+$0.27 at 91%) |
| Break-even | At an 85% payout a trade needs to win more than 54.1% of its decided trades to break even (1 ÷ 1.85); at 91%, more than 52.4% (1 ÷ 1.91). |
A replay is only a look back at candles recorded on the dates above: it placed no real orders, covers about four and a half days of one pair, and counts overlapping trades as if they were independent. A short test proves nothing about the future, and no profit and no win rate is promised here. IQ Option’s own blog on backtesting says that most strategies need dozens, and often hundreds, of trades before a result means anything.
In the default Daily mode the rule gave no signal at all, because K never crossed zero after its warm-up. In Weekly mode the two events came together 18 times; the one-candle and three-candle results differ a lot, and with 18 signals neither one says anything about the rule. No expiry is given, so the box shows both.
Pros and Cons of the Special K
| Pros | Cons |
|---|---|
| Combines short, intermediate and long cycles in one line, so it reacts to more than one time scale. | Needs a long history: about 725 candles in Daily mode before K is complete. |
| Zero line and a smoothed second line give a simple picture of positive and negative momentum. | It lags: every term is a moving average of a change. |
| Two modes with different period sets, so the speed can be changed without typing numbers. | On 5-minute candles the default Daily mode did not cross zero once in 368 candles, so a cross-of-zero rule rarely fires. |
Common mistakes
- Reading the line before it is complete. In Daily mode the first 725 candles of the data the platform has loaded are a partial sum; do not trade a cross there.
- Assuming the names Daily and Weekly refer to the chart. They name two sets of periods, counted in candles, on any candle size.
- Expecting a cross of zero to come with every EMA 100 cross. In our recording the EMA 100 was crossed 75 times in the first stretch and K crossed zero 23 times (Weekly mode).
- Using it alone. A lagging sum of changes says what has happened, not what comes next; test any rule on a Practice balance first.
Related guides
- Coppock Curve on IQ Option and Know Sure Thing on IQ Option
- Rate of Change on IQ Option and Momentum on IQ Option
- Trading with the EMA and leading and lagging indicators
- All indicator guides and all strategy guides
Frequently Asked Questions
Q: What is the Special K indicator?
A: A momentum indicator named after Martin Pring. It sums twelve smoothed rates of change, with weights from 1 to 4, into one line, K, around a zero line; a second line, MA, smooths K further.
Q: What settings does the Special K have on IQ Option?
A: The Mode (Daily or Weekly), Period 1 and Period 2. The dialog opens with Daily, 100 and 100; the Colors and display tab has a colour and a line style for K and for the MA line.
Q: How many candles does the Special K need?
A: In Daily mode the longest term needs 530 candles of price plus a 195-candle average, so about 725 candles before K is complete; the MA line with its defaults needs about 200 more. In Weekly mode K is complete after about 143 candles.
Q: What does a cross of zero mean?
A: That the weighted sum of the smoothed changes has changed sign. It is a description of what the price has done over the last candles, not a forecast.
Q: Does the Special K work with the EMA 100?
A: They are combined. In the default Daily mode we found no signal in 368 candles after the warm-up; in Weekly mode there were 18, and their results are in the tested box. It is too few to say anything.
Q: Can I use it on binary options?
A: The platform draws it on any chart. Whether it helps is something to test on the Practice balance, with the expiry you plan to use.

