
Phase 1: Understand · 8 min
Use candles, swing structure and zones to describe what price did—without turning a pattern name into a promise.
By the end, you can:
- Read the open, high, low and close of a candle.
- Describe trend and range using visible price structure.
- Build a short, repeatable chart-reading routine.

Start with what the chart can prove
A chart is a time-ordered record of quoted prices. It can show where price traded and how it changed. It cannot show the future or reveal every participant’s intention. Begin with observations that another person could verify on the same chart.
The four prices in a candle
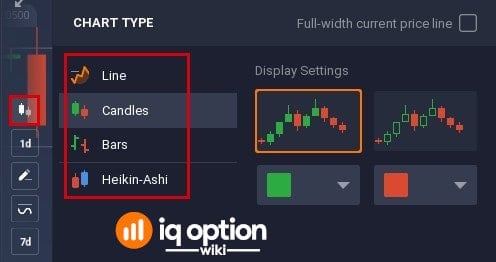
For one chosen time interval, a candlestick records the open, high, low and close. The body spans the open and close. The wicks extend to the high and low. Candle color tells you whether the close finished above or below the open.
The timeframe matters. A five-minute candle and a daily candle summarize very different intervals. Always state the timeframe when you describe a chart.
“The candle closed above its open after testing a lower price” is an observation. “Buyers will win next” is a prediction. Keep those two sentences separate.
Structure before indicators
Mark obvious swing highs and swing lows. A sequence of higher swing highs and higher swing lows is commonly described as an uptrend; lower highs and lower lows as a downtrend. When price repeatedly moves between broadly similar upper and lower areas, it is behaving more like a range.
Support and resistance are better treated as zones where price previously reacted, not exact lines that must hold. A zone can fail. More tests do not guarantee a bounce or a break.
A five-step chart routine
- Name the instrument and timeframe. Do not compare observations from different charts as if they were the same.
- Zoom out. Find the visible swing structure before focusing on the latest candle.
- Mark only clear zones. Use areas with visible reactions; avoid filling the chart with lines.
- Describe the current location. Is price near a prior zone, in the middle of a range or extending away from structure?
- Write what would disprove the idea. An invalidation condition is more useful than a confident prediction.
Indicators are summaries, not answers
Moving averages, oscillators and other indicators transform past or current price data. They may help organize a rule, but adding more indicators does not create certainty. If you use one, be able to explain its input, setting and role in the test.
Demo exercise
Practice: describe, do not predict
Take a screenshot of one demo chart. Write five facts: instrument, timeframe, latest candle’s open/close relationship, visible swing structure and nearest clear zone. Then write one separate hypothesis and one condition that would invalidate it. Do not place a trade for this exercise.
Knowledge check
Answer two questions
Choose an answer and feedback appears immediately. Both answers mark this lesson complete in this browser.